
BI Dashboard for Insurance Brokers & Finance Teams
Insurance Brokers Need More Than Monthly Reports
Static spreadsheets and delayed reports make it hard for insurance brokers to stay ahead of client retention issues, member churn, and portfolio performance.
This is where a custom BI dashboard makes the difference.
With real-time views across clients, plans, and member activity, brokers and finance teams can proactively manage relationships, identify risk patterns, and make faster decisions all without manual data prep.
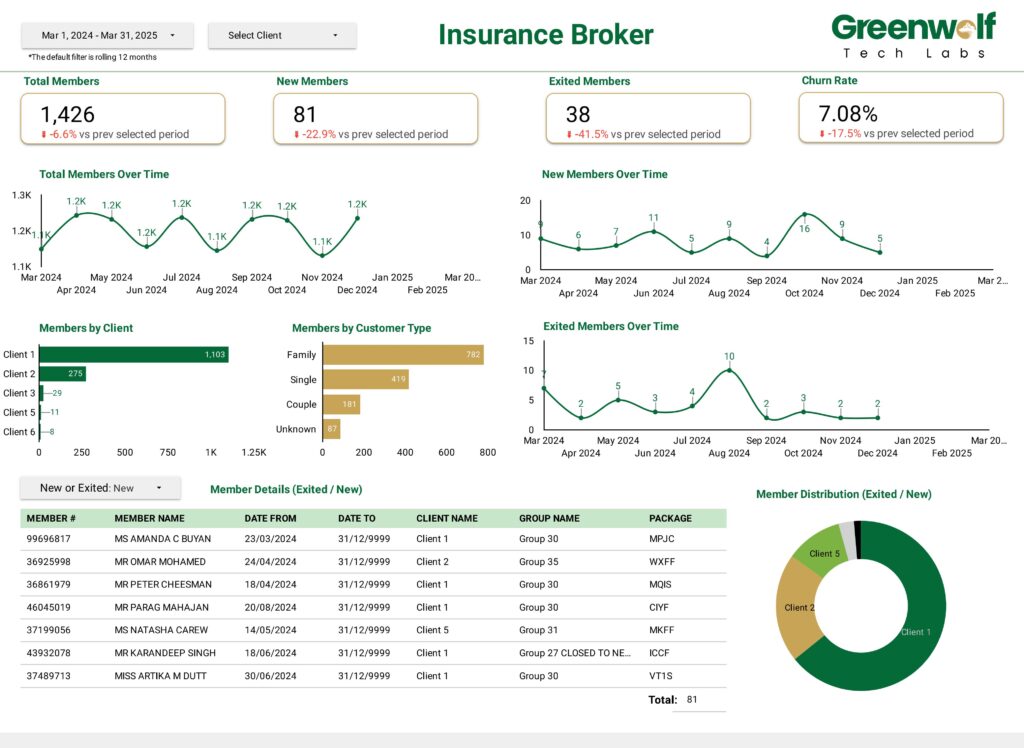
Core KPIs Insurance Teams Should Monitor
Total Members
Track your active book of business across all clients. See YoY and MoM changes in one place.
New vs Exited Members
Monitor acquisition and attrition trends over time to assess onboarding and retention performance.
Churn Rate
One of the most critical indicators this shows how many members are leaving relative to your total base.
Members by Client
Identify which clients drive most of your volume and which need intervention.
Members by Customer Type
Track enrollment patterns by family, single, couple, or unknown segments useful for plan design and upselling.
Monthly Trends
See new joins and exits by month to detect seasonal patterns or campaign impacts.
Member-Level Details
Drill down to individual member records join date, client, plan group, and package for auditability and follow-up.
Designed for Brokers. Customized for Your Setup.
The dashboard you see above is just one version. We build tailored dashboards for insurance firms, brokers, and financial services teams based on your unique portfolio structure, client mix, and data sources.
Whether you’re managing:
- Corporate benefit clients
- Group insurance plans
- Third-party admin (TPA) models
- Hybrid finance insurance setups
…we’ll build around your process and terminology, not force you into a generic template.
How This BI Dashboard Helps You Work Smarter
- No more manual tracking: All data updates automatically
- Instant visibility: Spot churn spikes or client issues before they escalate
- Client-ready: Use views like “Members by Client” and “Churn Rate” directly in review meetings
- Member level granularity: Useful for escalations, audits, or compliance queries
- Smart filtering: Toggle between new and exited members with one click
We’ve also included donut charts, time-series trend lines, and interactive tables all designed to make exploration fast and easy for non-technical users.
Frequently Asked Questions
What is a BI dashboard for insurance brokers?
It’s a real-time reporting tool that lets insurance brokers track clients, members, churn, and plan performance all in one place.
Can this dashboard be customized to our business model?
Yes. We tailor every dashboard to your data structure, client base, and internal KPIs including multi-branch setups.
What data sources can this pull from?
This can connect to CRM systems, policy admin software, Excel sheets, SQL databases, or cloud storage based on your setup.
Does this support drill-down to member-level data?
Absolutely. You can view every new or exited member with full details like join date, package, and client.