
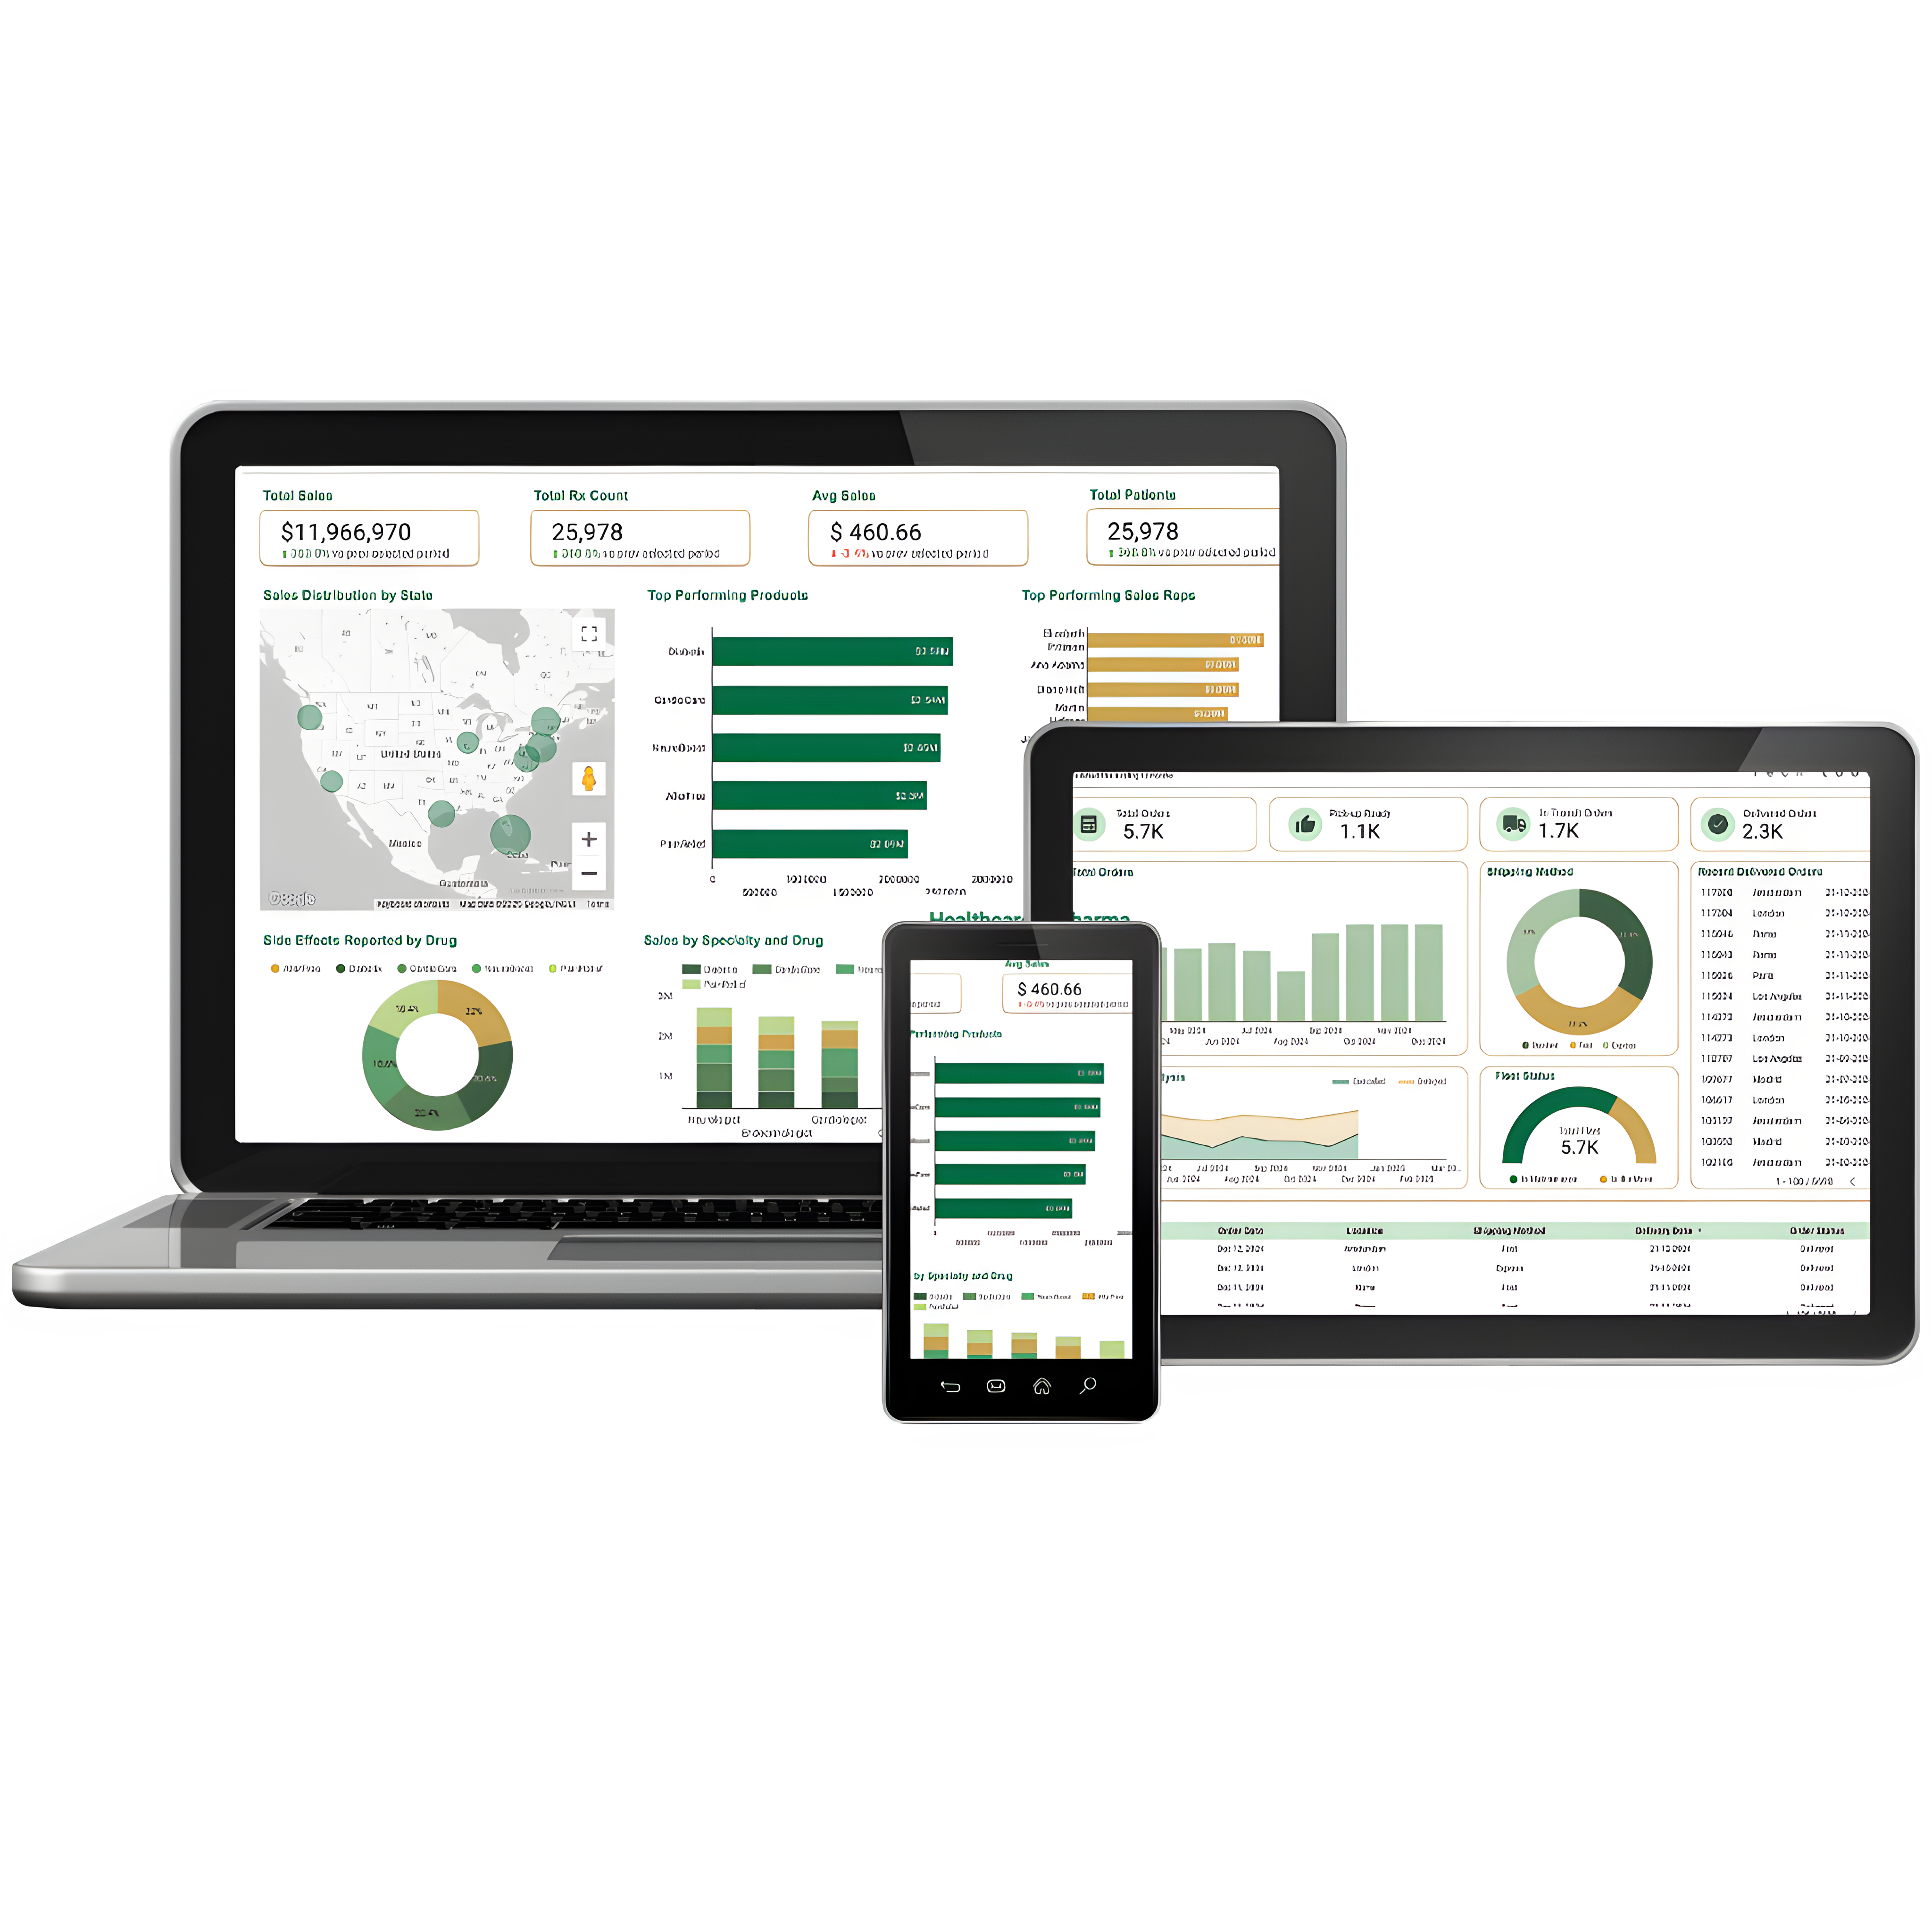
Why Your Business Needs a Looker Studio / Data Studio Dashboard
How Businesses Like Yours Use Dashboards to Drive Results
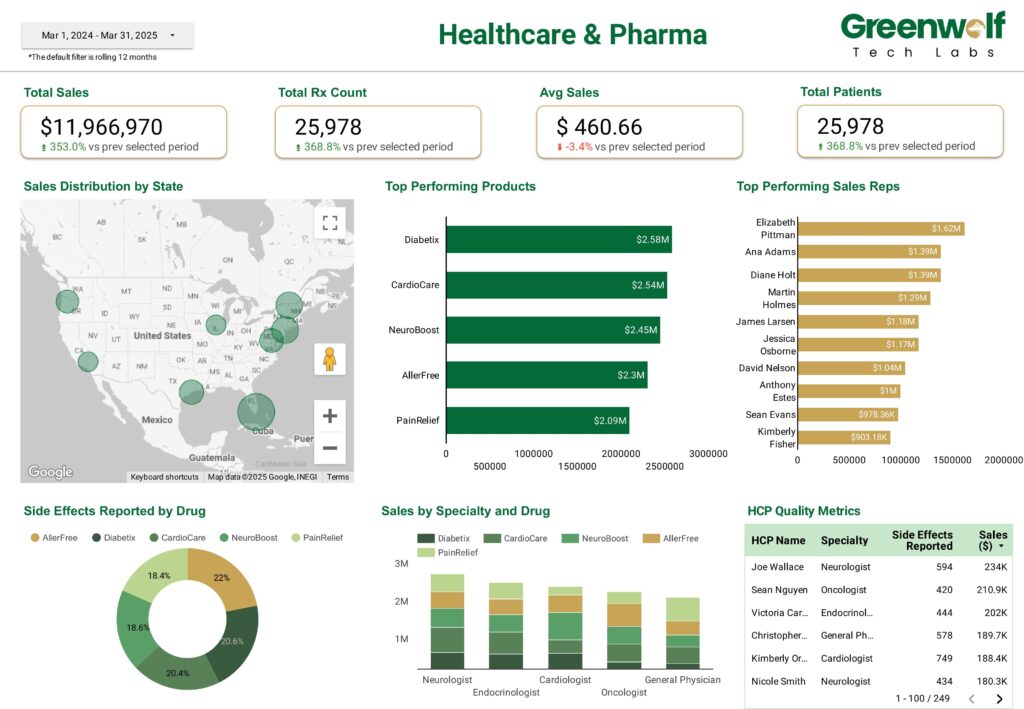
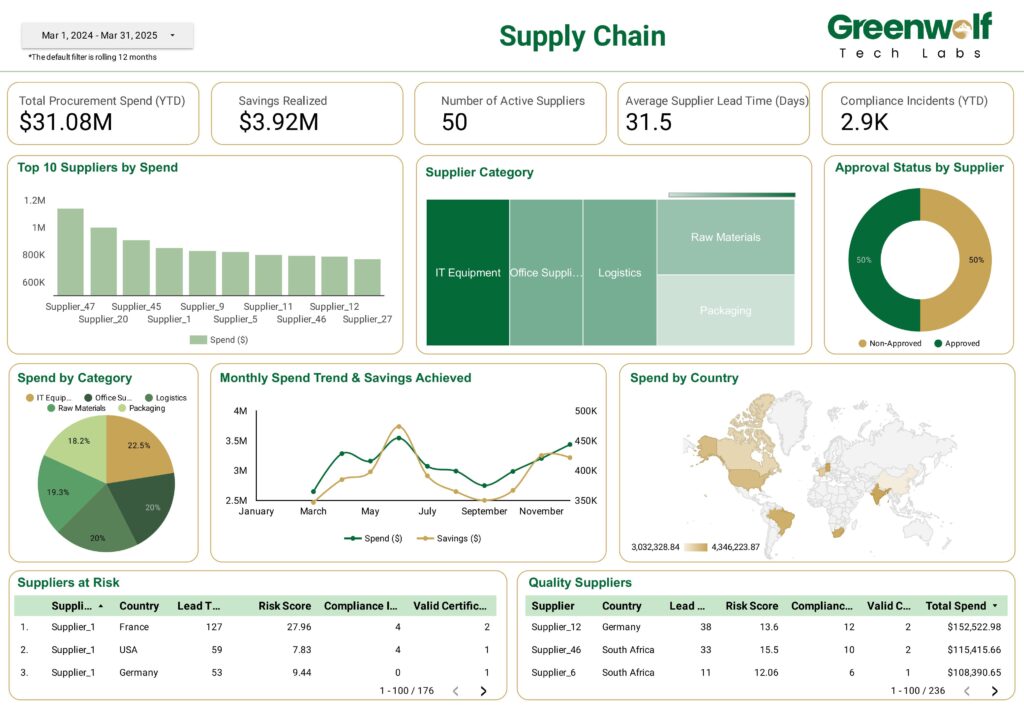
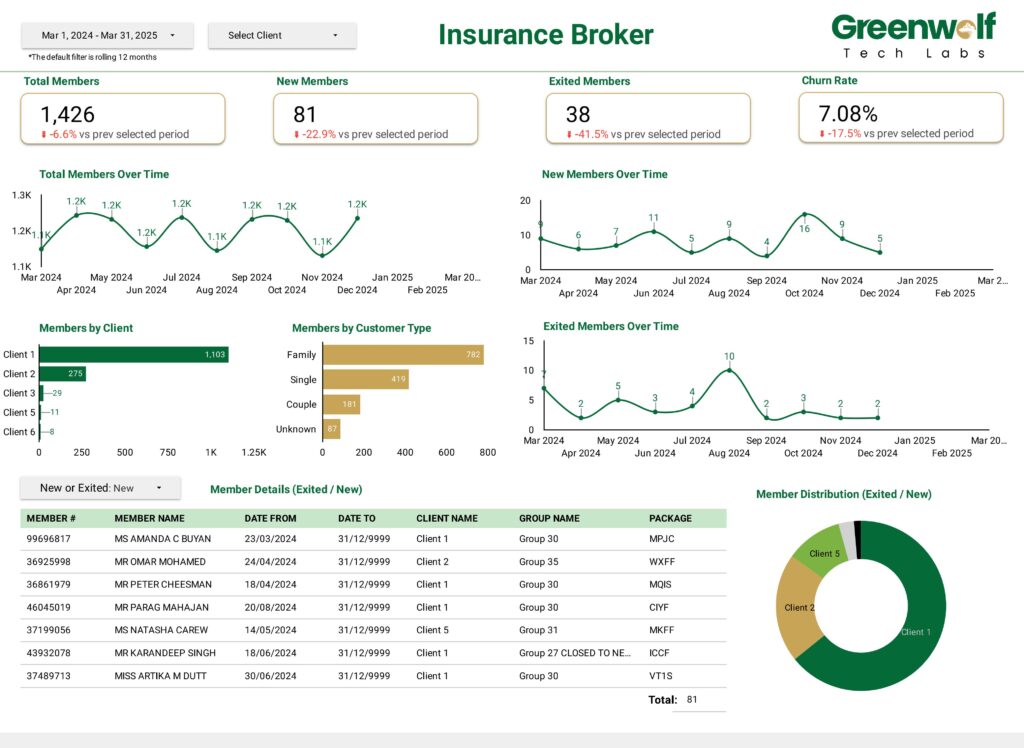
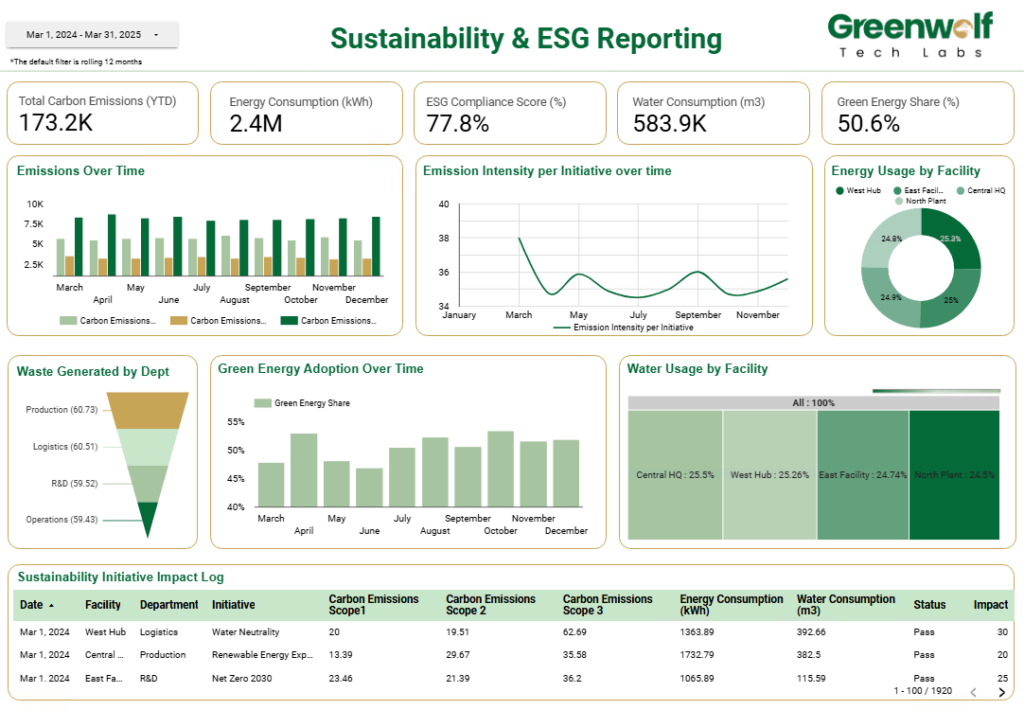

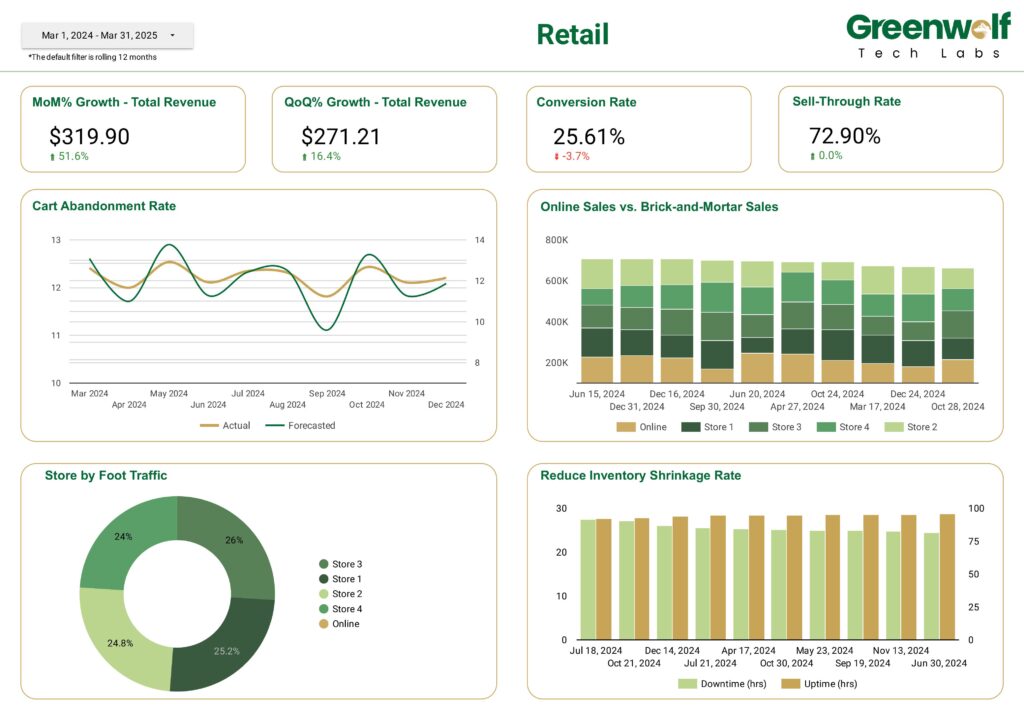
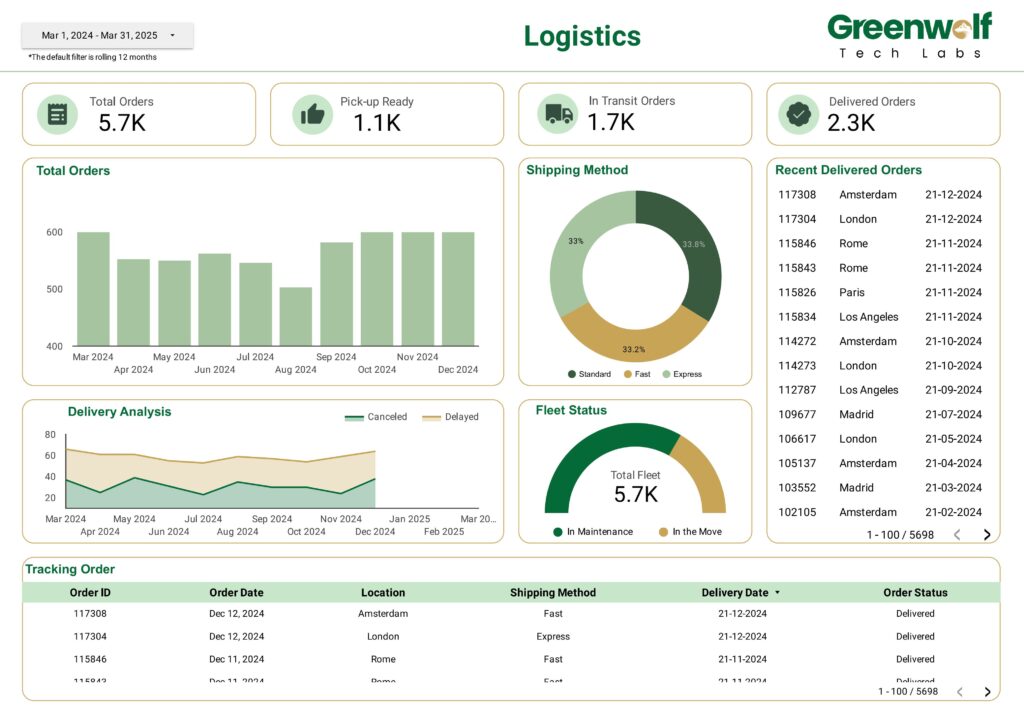
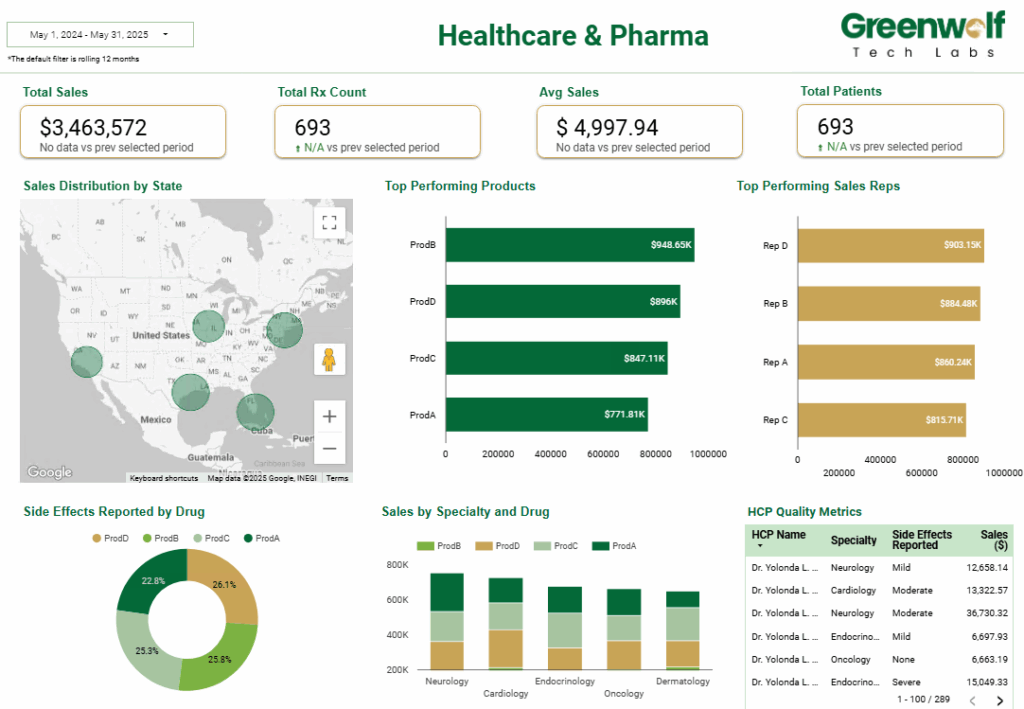
What Makes Our Dashboards a Growth Engine
Enhanced Decision-Making
Turn fragmented data into actionable insights. Our dashboards help business leaders make faster, clearer decisions with confidence.
Improved Productivity
Automate routine reporting, reduce manual work, and free up your team to focus on high-impact activities.
Cost Efficiency
Custom-built to your needs, not your budget cap. Our pricing is designed to deliver ROI, not generic software fees.
Centralized Data Management
Unify data from spreadsheets, tools, and systems into one powerful view. Eliminate silos and get the full story in one place.
Real-Time Insights
Stay in sync with what’s happening across your business live dashboards ensure you’re always a step ahead.
Scalability
Whether you’re 5 people or 500, our dashboards scale with your complexity without adding chaos.
Your Data, Wherever It Currently Lives
We connect Looker Studio to the systems you already run, blend them into one model, and build the calculated metrics your reporting actually depends on.
Google Ads & GA4
Spend, conversions and attribution reported side by side, not in two tabs.
Meta & LinkedIn Ads
Paid social blended with search so channel performance is comparable.
BigQuery
Large datasets modelled in SQL first, so dashboards stay fast at scale.
Google Sheets & Excel
The spreadsheets your team maintains, pulled in without breaking their workflow.
Shopify & WooCommerce
Orders, margin and repeat purchase behaviour tracked against ad spend.
HubSpot & Salesforce
Pipeline and revenue joined to the marketing activity that created it.
MySQL & PostgreSQL
Direct database connections for operational and product reporting.
Custom APIs
No native connector? We build the pipeline that gets the data in.
Working with something not listed here? We have almost certainly connected it before.
Straightforward Pricing
Fixed scope, fixed price, agreed before we start. No hourly billing and no surprises at the end of the project.
Single Dashboard
One report built on one or two data sources.
Typically 1 to 2 weeks
- Requirements and KPI definition
- Up to 2 data sources connected
- Calculated fields and blends
- One round of revisions
- Handover walkthrough
Multi-Source Build
Several systems joined into one reporting layer.
Typically 3 to 5 weeks
- Discovery and wireframing
- Multiple sources blended
- Data modelling and cleanup
- Automated refresh schedule
- Team training session
- 30 days post-launch support
Ongoing Support
For dashboards that need to keep changing.
Rolling monthly
- New metrics and views on request
- Data source maintenance
- Performance tuning
- Priority turnaround
- Named point of contact
Every engagement starts with a free scoping call. You get a fixed quote before any work begins.
From data discovery to dashboard delivery