
BI Dashboard for Supply Chain & Supplier Performance
Procurement and Supply Chain Need More Than Spend Reports
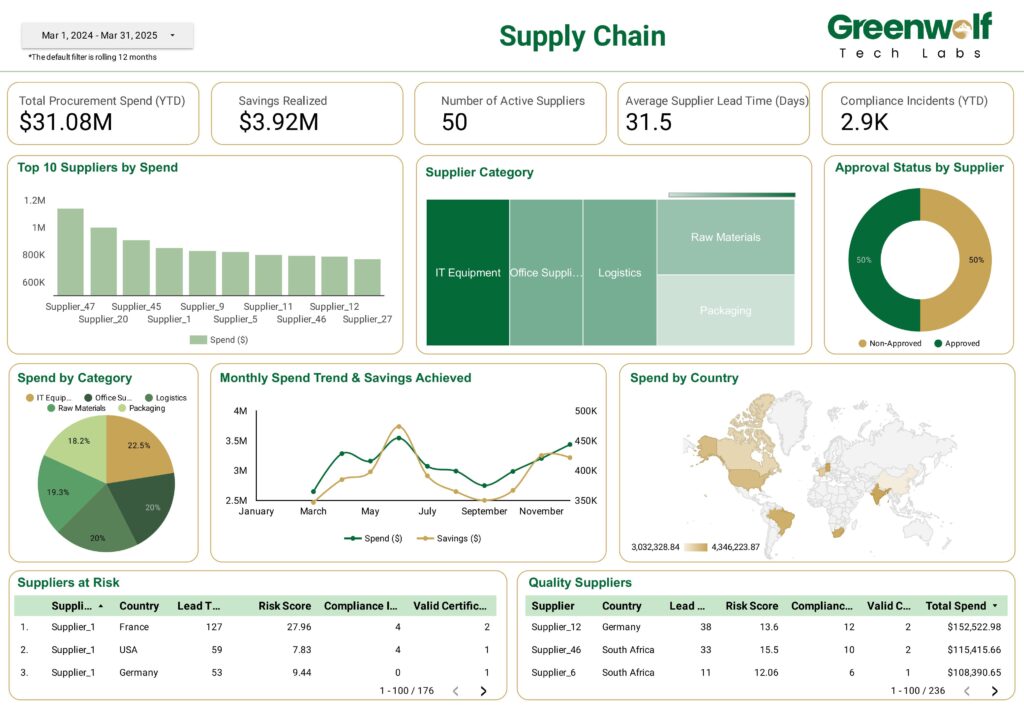
Most supply chain teams track spend, but that’s just the surface. Real control comes from understanding supplier risk, compliance incidents, approval status, and lead time trends all in one place.
That’s where a custom built BI dashboard helps.
The example above is designed for supply chain, procurement, and sourcing teams to act faster, track performance at a glance, and catch issues before they hit operations.
Key KPIs to Track in a Supply Chain Dashboard
Total Procurement Spend (YTD)
Know how much you’ve spent across suppliers, categories, and geographies updated automatically.
Savings Realized
Track value captured through negotiations, re sourcing, or early payment discounts.
Number of Active Suppliers
Monitor supplier concentration and diversification risks across the network.
Average Supplier Lead Time
Keep an eye on fulfillment speed and flag suppliers who are consistently late.
Compliance Incidents
Spot patterns in documentation lapses, audits, or regulatory breaches.
Top 10 Suppliers by Spend
Quickly identify who you rely on the most and assess their compliance status.
Supplier Approval Status
Ensure high spend suppliers are properly vetted and certified.
Monthly Spend vs Savings
Track month over month cost and cost avoidance metrics in a single trend line.
Suppliers at Risk
Get a filtered view of suppliers with high lead time, risk score, or missing certifications.
Tailored to Your Sourcing and Procurement Model
This dashboard is fully customizable we’ve designed variations for:
- Direct and indirect procurement
- Category managers
- Global sourcing teams
- Regulatory-heavy verticals (e.g., pharma, aerospace, food)
We align the dashboard to your exact workflows, whether you manage 50 or 5,000 suppliers.
How Supply Chain Leaders Use This Dashboard
- Category Managers: Spot cost saving opportunities by vendor or region
- Procurement Ops: Ensure compliance and approvals are always in place
- Sourcing Heads: Compare supplier performance across countries
- Finance: Track realized vs planned savings for quarterly reviews
- Risk Teams: Monitor lead times and risk scores in one consolidated view
With real time updates and flexible filters, it’s easier to go from a 10,000 foot view to specific supplier level actions in seconds.
Frequently Asked Questions
What is a supply chain BI dashboard?
A visual interface that lets supply chain and procurement teams track supplier performance, spend, risk, and compliance in real time.
Can this dashboard be customized to our sourcing process?
Yes. We tailor the views, metrics, and logic based on your supplier tiers, approval flows, and business rules.
What tools can this connect to?
This can pull data from your ERP (e.g., SAP, Oracle), SRM, Excel trackers, or even audit management systems.
Does it support regional and category-level views?
Absolutely. You can filter by country, supplier type, category, and more all configurable.