Pharma Channel Sales Dashboard
Why Channel Visibility Matters in Pharma
Channel complexity in pharma is unavoidable. Between wholesalers, specialty distributors, pharmacies, and SP hubs, visibility into what’s actually driving sales can get murky.
A pharma channel sales dashboard gives teams clarity on how products are moving through the value chain. It connects the dots between what HQ sees and what’s happening across shipments, support services, and case resolution.
What a Channel Sales Dashboard Tracks
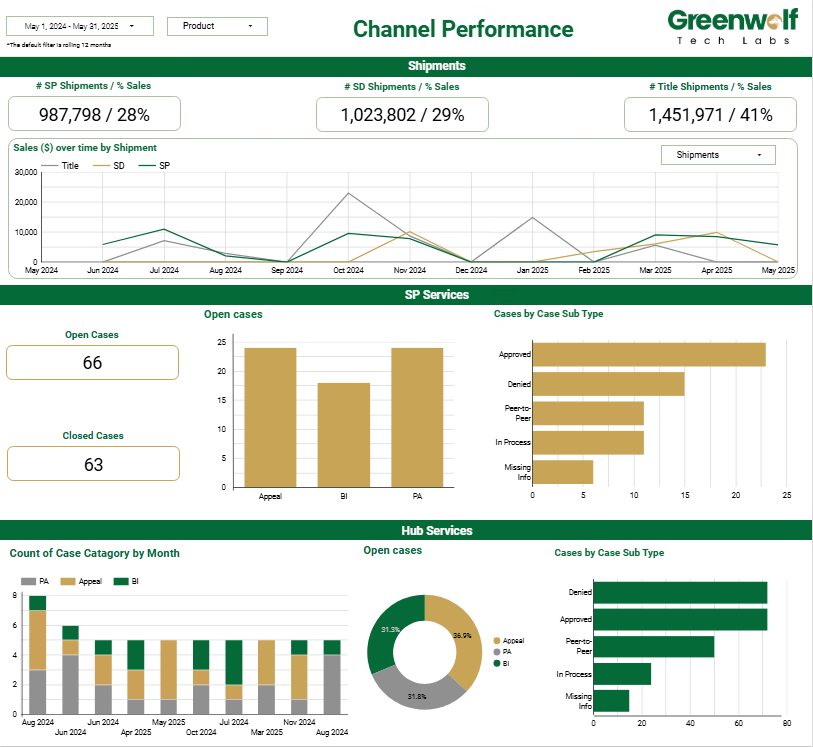
Shipment mix and volume contribution Break down SP, SD, and Title shipments to see their respective share in overall sales — for example, 28% from SP, 29% from SD, and 41% from Title.
Trendline of sales over time Visualize fluctuations across shipment types over a 12-month window to catch performance dips or seasonality.
Open vs. closed service cases Track case counts tied to SP services (e.g., PA, BI, Appeals) and hub activity to assess operational load and resolution rates.
Case sub-type analysis Drill into specific service areas (like Denied, Approved, Peer-to-Peer) to understand friction points and approval patterns.
Data Sources Typically Integrated
To give a true channel view, these dashboards often pull from:
- ERP systems for shipment and sales data
- Specialty pharmacy and distributor reporting feeds
- SP hub service platforms (case management)
- Claims, approvals, and appeal systems
Bringing these data streams together reduces blind spots across fulfillment and support workflows.
Use Cases for Commercial and Trade Teams
Shipment portfolio mix monitoring Helps leadership understand shifts in reliance between SP, SD, and Title partners month over month.
Support services trend analysis Enables patient services and trade teams to forecast case volumes and resource needs by case type and partner.
Channel friction identification High denied rates or excessive peer-to-peer cases can flag education gaps or access issues needing cross-functional action.
How We Build It at Greenwolf
We start by understanding your distribution model, partner mix, and service workflows. Then we design a dashboard that surfaces the exact signals your teams need.
Our pharma clients typically ask for:
- Shipment splits with year-over-year tracking
- SP and hub case insights by type, status, and partner
- Role-based access for trade, SP ops, and case management leads
Pharma Sales Ops Dashboard
Frequently Asked Questions
What is a pharma channel sales dashboard?
A tool that helps pharma companies monitor product movement, pricing, and performance across their distribution network.
How is this different from a regular sales dashboard?
A standard sales dashboard focuses on final sales numbers. A channel sales dashboard shows how products move through trade partners before reaching the customer.
Can it handle multiple countries or regions?
Yes. Dashboards can be designed to support regional variations in trade structure, pricing, and data availability.