
The 60% Blind Spot: Why Most Patient Services Data Never Informs Decisions
Pharmaceutical companies today invest heavily in patient services programs covering access support, copay assistance, adherence monitoring, and more. These initiatives generate mountains of patient level data, ranging from prescription fill rates to call center interactions.
Yet, research shows that up to 60% of this data never makes its way into actual decision making. The result? Pharma companies miss opportunities to truly understand what drives patient access, adherence, and long term outcomes.
Why So Much Patient Services Data Gets Wasted?
Despite advanced CRM systems and patient hubs, pharma often struggles to convert raw data into actionable insights. Common reasons include:
Fragmented Systems and Silos
Different vendors, platforms, and affiliates collect data independently, making it difficult to connect the dots across the patient journey.
Manual Reporting Bottlenecks
Many organizations rely on static spreadsheets and delayed reports, meaning insights come too late to influence real-time decisions.
Focus on Volume, Not Value
The push to “collect everything” often overshadows the need to measure the right metrics those that directly link to patient access and adherence.
How Automation and Dashboards Close the Gap
The good news is that automation and integrated dashboards are changing the game for patient services teams.
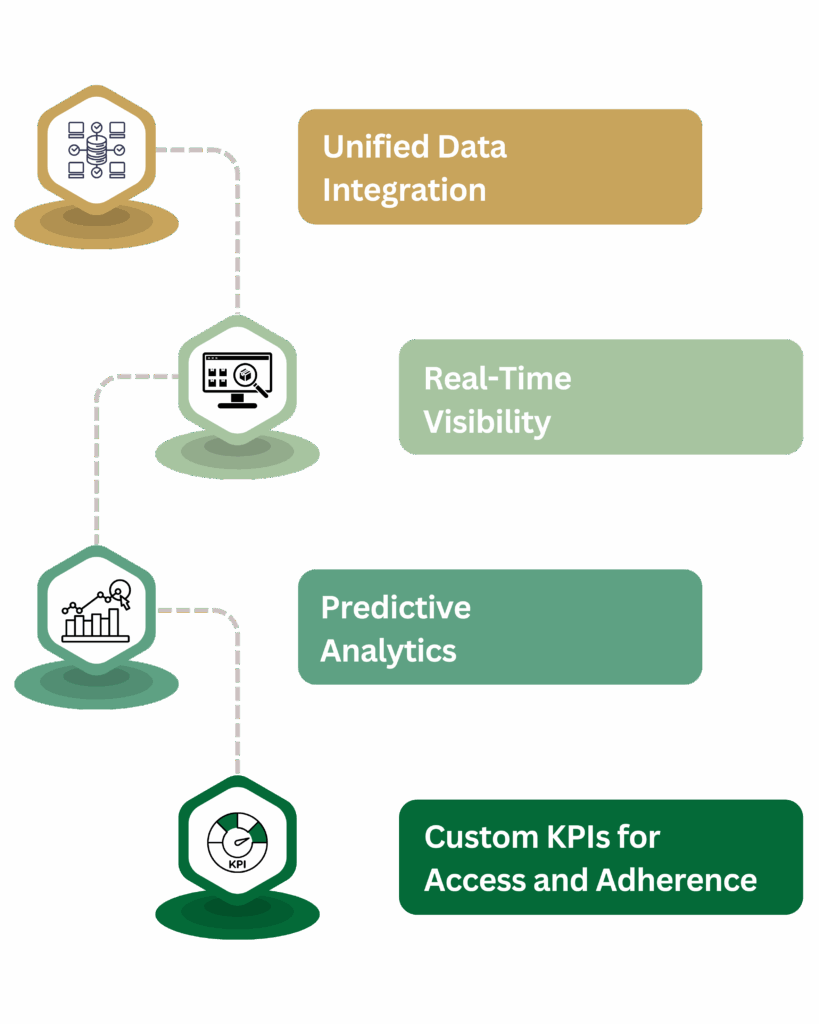
Unified Data Integration
Automation tools pull data from multiple sources call centers, pharmacies, field teams, and digital touchpoints into a single, clean dataset.
Real-Time Visibility
Dashboards powered by automation show live insights into patient enrollment, prior authorization approvals, and therapy initiation. Decision makers no longer have to wait weeks for reports.
Predictive Analytics
AI models can identify which patient cohorts are at higher risk of drop off and proactively suggest interventions to improve adherence.
Custom KPIs for Access and Adherence
Instead of drowning in data, pharma leaders can focus on the 5–10 metrics that truly matter for patient outcomes, like time to therapy and refill persistence.
Benefits of Closing the Patient Data Blind Spot
- Better Patient Access – Faster insights into prior authorization and reimbursement hurdles.
- Improved Adherence – Timely identification of patients at risk of discontinuing therapy.
- Cost Efficiency – Reduced reporting overhead and faster ROI from patient support programs.
- Strategic Clarity – Clear visibility into which services actually impact patient success.
Real World Example
A global pharma company integrated its fragmented patient services data into an automated dashboard. Within six months, they uncovered that only 20% of patients enrolled in copay assistance were persisting past three months. This insight enabled targeted outreach campaigns, leading to a 15% increase in adherence rates.
Challenges and Considerations
- Data dependency: AI requires accurate traffic, location, and demand data.
- Integration: Must connect seamlessly with existing fleet management systems.
- Cost of adoption: Small fleets may find initial AI setup expensive.
The Future of Patient Services Insights
As automation, AI, and integrated dashboards continue to evolve, pharma will finally overcome the 60% blind spot. Instead of drowning in unused patient data, organizations will have the tools to translate it into decisions that matter faster access, stronger adherence, and better outcomes for patients.