

WolfSight
WolfSight
Dashboards that shorten a decision, not decorate a report.
Get a free proposal
Tell us what you need. A consultant replies within one working day.
01
Business Dashboards, Custom-Built for You
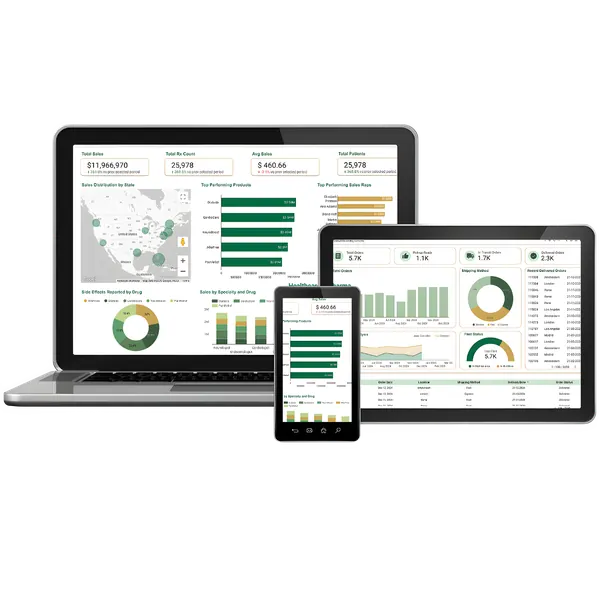
We don’t just build dashboards, we craft a window into your business’s heartbeat. Every metric, every chart, shaped around what truly moves you forward. No clutter, no noise, just clarity you can feel, decisions you trust, and time you get back for what matters most
02
Why Your Business Needs a Dashboard
One Source of Truth
All your key metrics centralized, synced, and always up to date. No more jumping between tabs or reconciling reports.
Faster, Smarter Decisions
With real-time visibility, your team can react faster, reduce delays, and make confident, data-backed calls every single day.
Identify Revenue Leakages
Spot inefficiencies and gaps before they become losses. Dashboards help you catch what spreadsheets miss.
See What Actually Drives Growth
Move beyond surface-level metrics. Understand which teams, products, or channels truly move the needle.
03
How Businesses Like Yours Use Our Dashboards to Drive Results
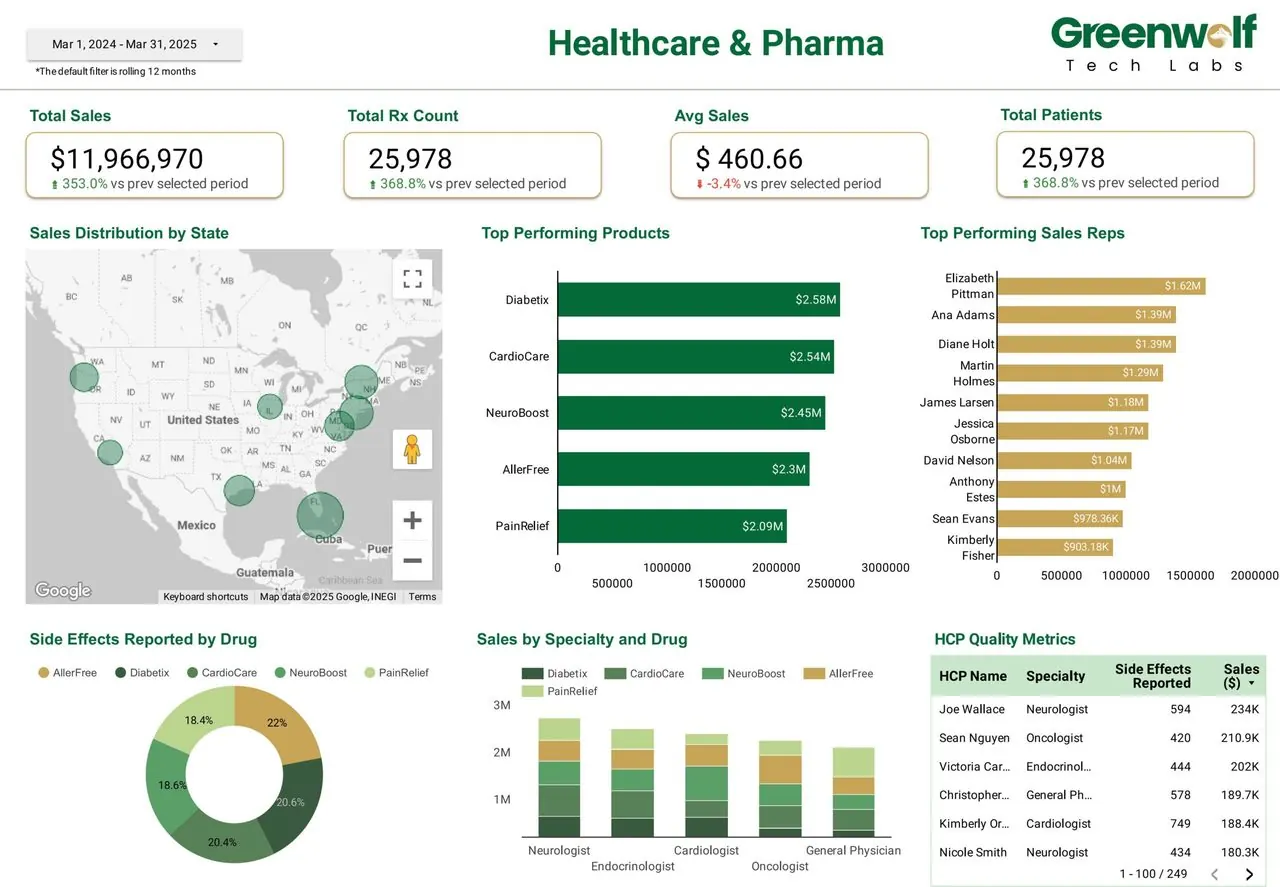
A top pharma client used our dashboard to connect clinical, sales, and compliance data across the U.S.
With over $11M in tracked sales and 25K+ prescriptions, they:
- Identified top-performing reps and products
- Tracked side effects by drug and specialty
- Spotted regional sales gaps in real-time
- Accelerated CAPA closures with linked batch data
What once lived in silos now powers informed, cross-functional decisions, driving both revenue and patient outcomes.
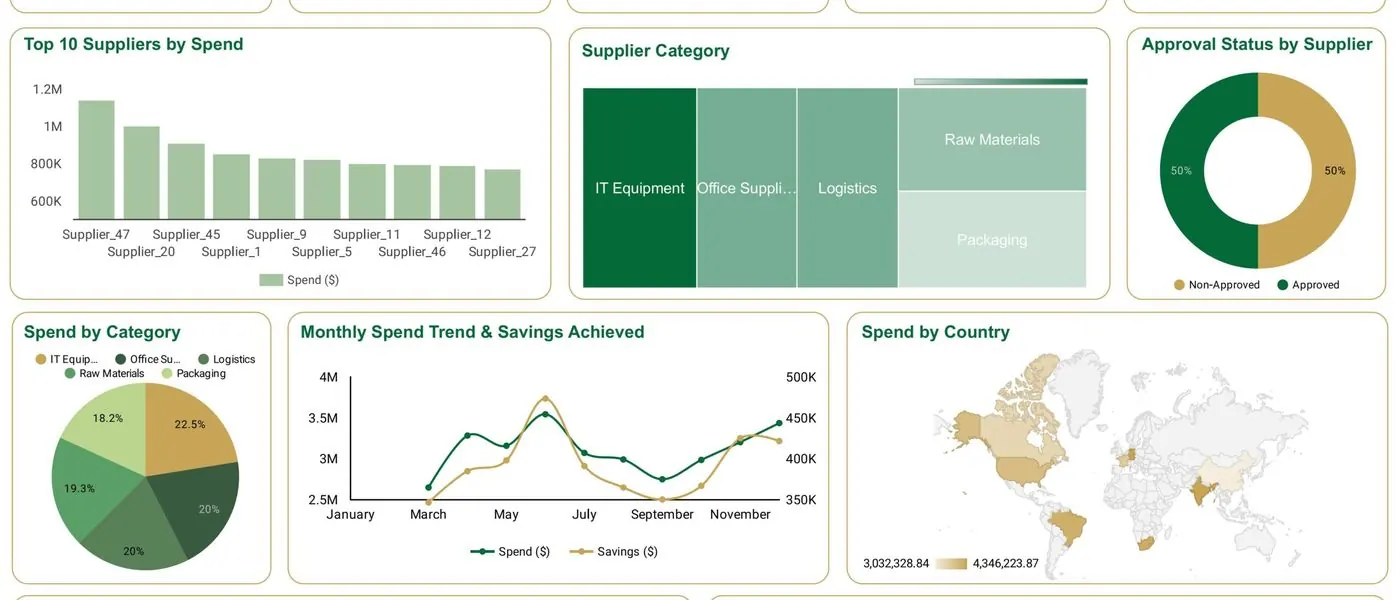
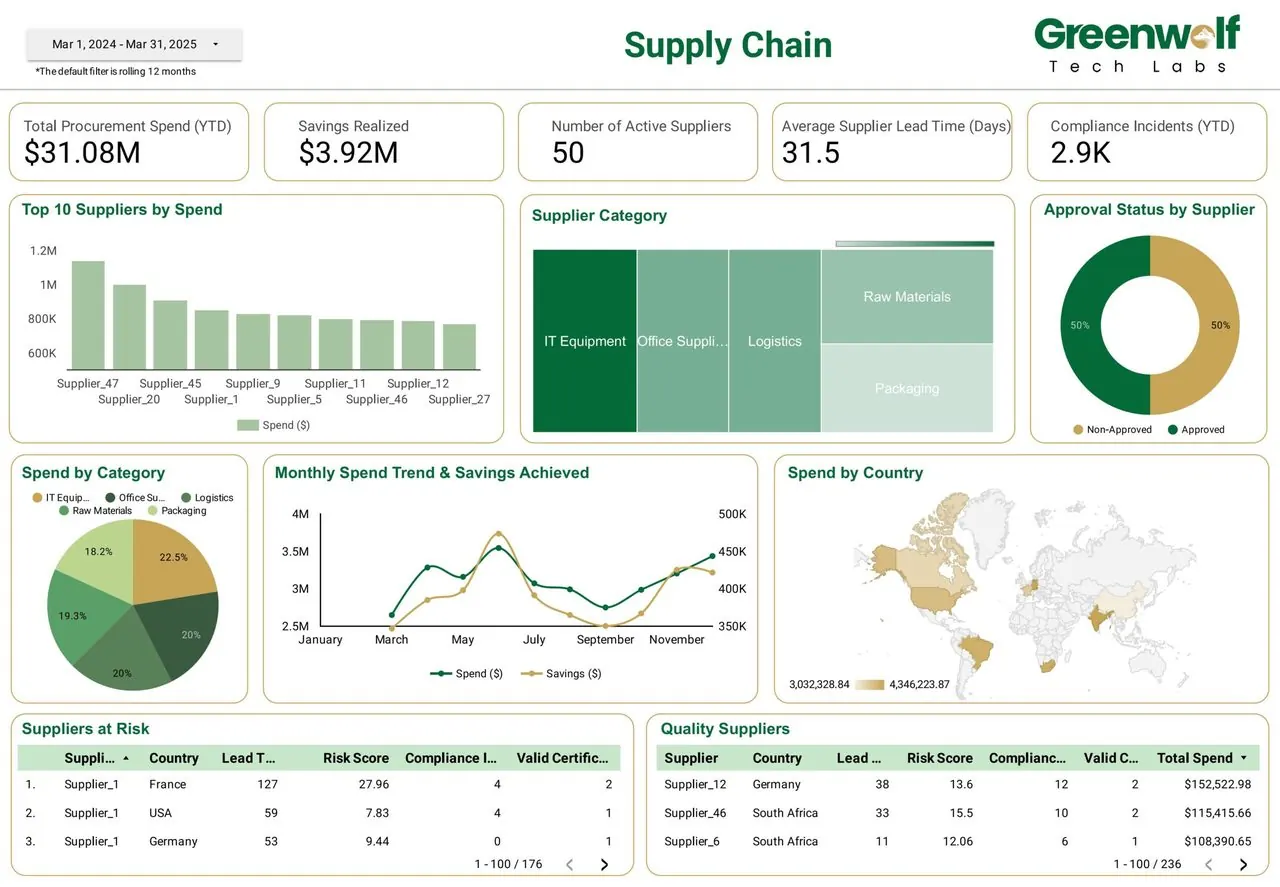
One of our global clients used this dashboard to manage $31M+ in procurement spend across 50+ suppliers. They now:
- Track lead times, compliance issues, and category spend in real-time
- Identify suppliers at risk with built-in risk and certification checks
- Monitor monthly savings trends and streamline approvals
- Uncover bottlenecks across geographies with spend-by-country analysis
With every key metric, from logistics to raw materials, in one place, the dashboard turned supply chain chaos into strategic control.
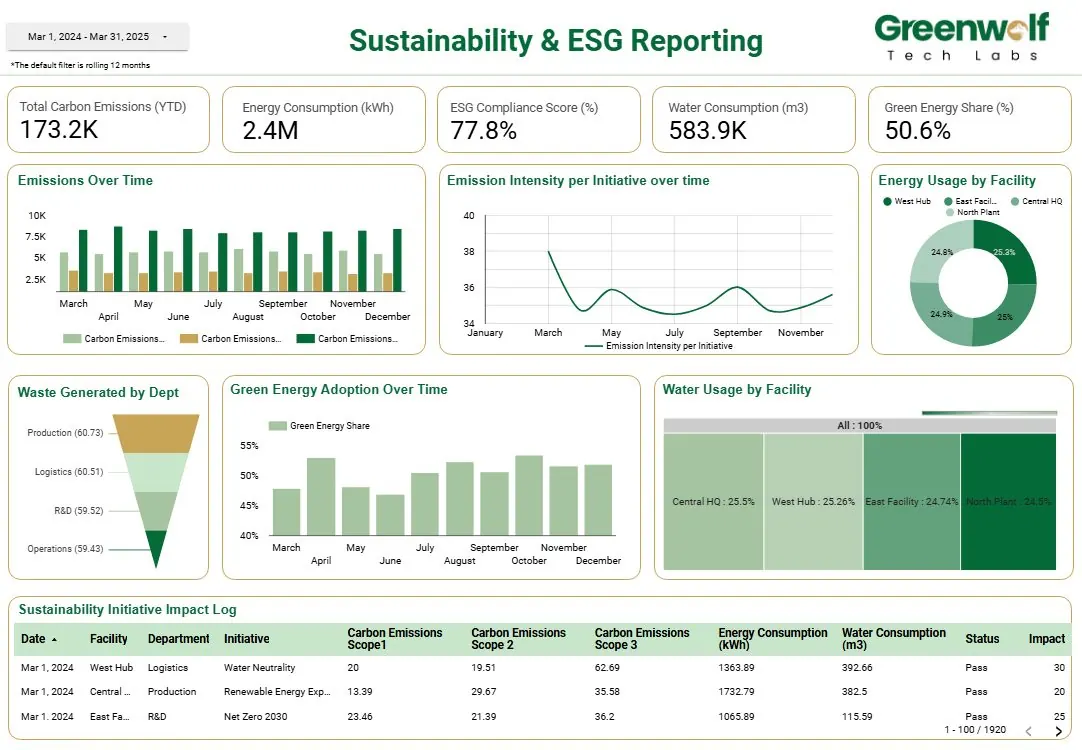
Sustainability & ESG Reporting
A multinational group adopted our ESG dashboard to centralize reporting across carbon emissions (173K+ tons), energy use, and green energy adoption. With this, they:
- Tracked compliance scores and initiative-level impact
- Monitored energy and water usage by facility
- Visualized green energy adoption over time
- Linked ESG metrics to long-term sustainability targets
This helped leadership not just report ESG, but drive it with clarity, compliance, and confidence.
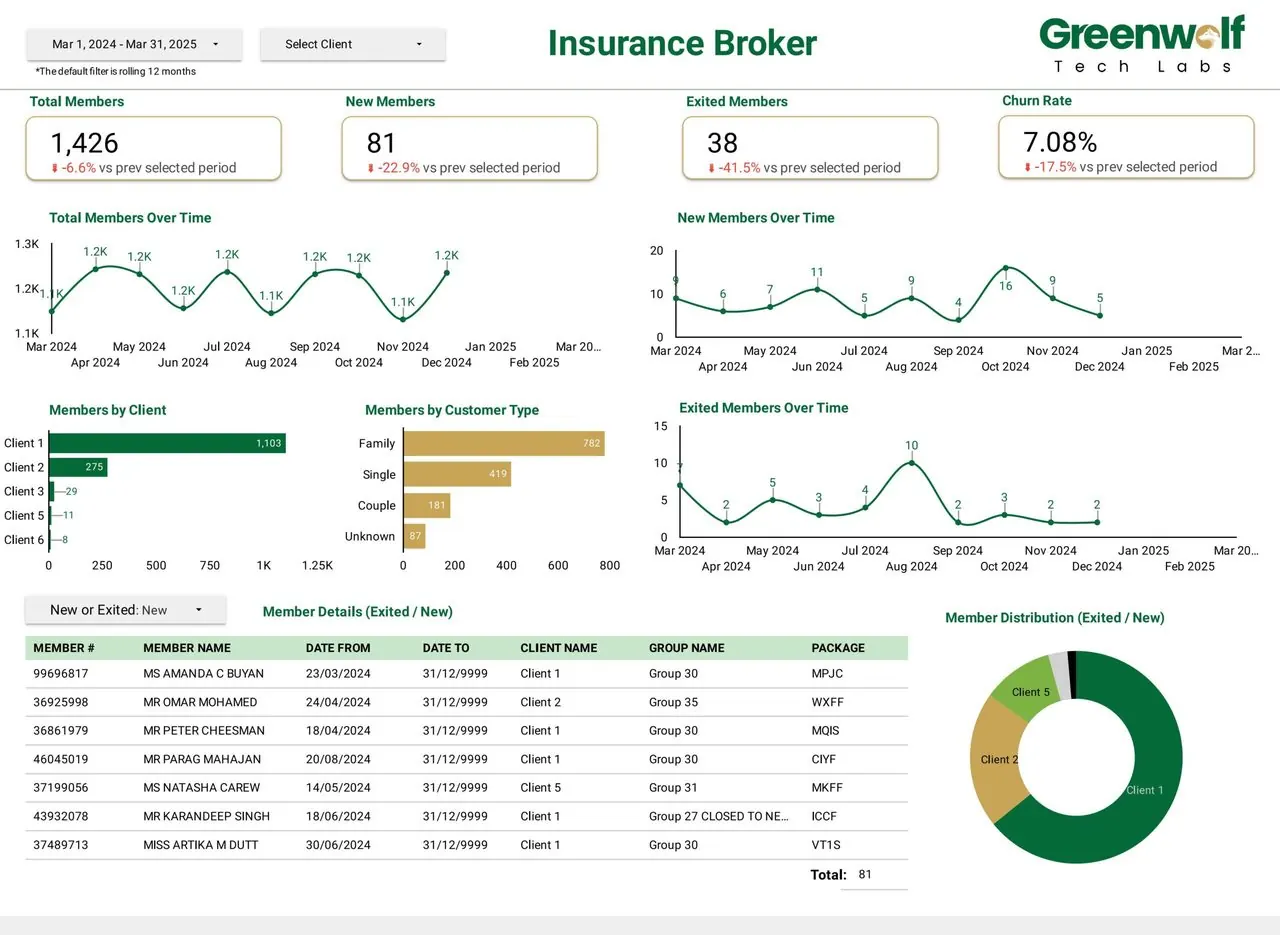
An insurance broker used this dashboard to manage 1,400+ members across multiple corporate clients. They leveraged it to:
- Track new vs exited members in real-time
- Analyze churn trends by customer type
- Monitor client-wise group activity
- Identify at-risk accounts and improve retention
What was once buried in spreadsheets became a single source of truth, supporting faster decisions and stronger client relationships.
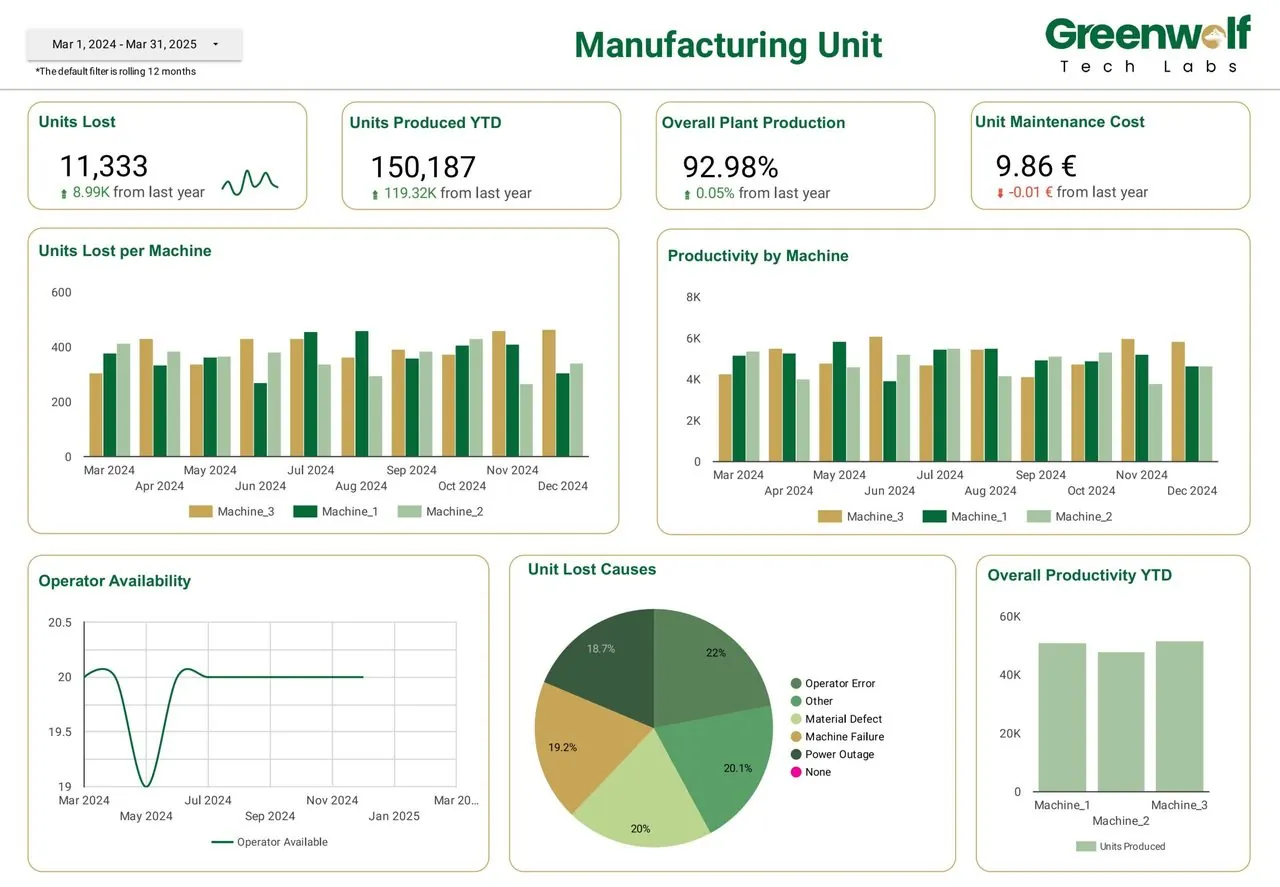
A global manufacturer used our dashboard to track over 150K units produced and analyze 11K+ unit losses across machines and months.
- Monitor productivity per machine in real-time
- Identify top causes of unit loss—operator error, machine faults, power issues
- Improve operator availability and reduce downtime
- Cut maintenance costs and raise plant efficiency to 92.98%
The result? A leaner, smarter production floor, with insights that drive measurable improvements daily.
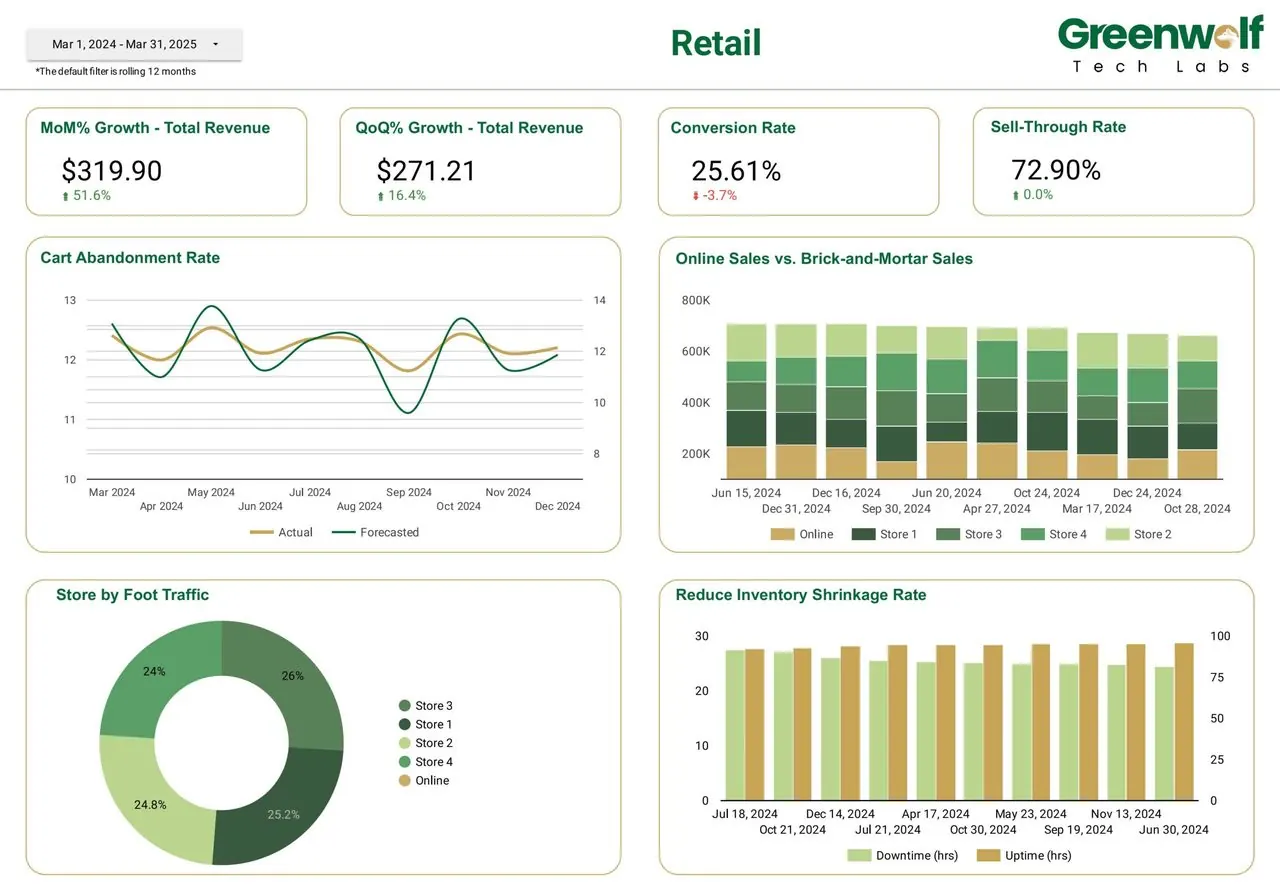
A retail brand used this dashboard to track revenue growth, cart abandonment, and performance across online and offline stores. With it, they:
- Compared online vs. brick-and-mortar sales in real time
- Identified high-traffic stores and optimized inventory
- Reduced shrinkage and downtime with data-backed actions
- Monitored sell-through and conversion across campaigns
The result? A unified view of operations, boosting agility, sales, and customer experience across every retail touchpoint.
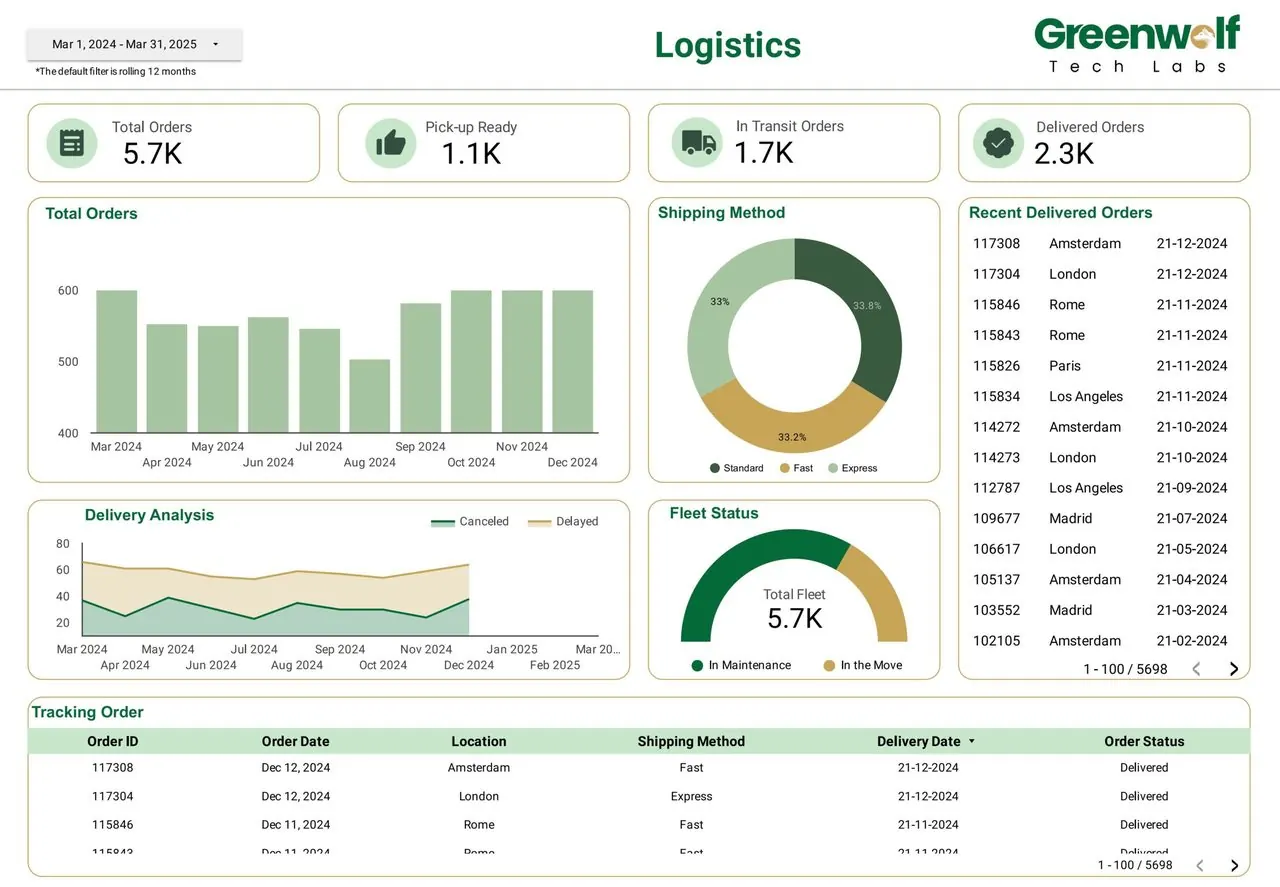
A logistics firm used this dashboard to manage 5.7K+ orders, with full visibility into pickup, in-transit, and delivered statuses. It enabled them to:
- Monitor fleet status and reduce delays
- Track real-time delivery performance across regions
- Optimize shipping methods (standard, fast, express)
- Identify bottlenecks across order and warehouse operations
With everything from dispatch to doorstep visualized clearly, they boosted delivery speed and operational efficiency, without guesswork.
04
What Makes Our Dashboards a Growth Engine
Enhanced Decision-Making
Turn fragmented data into actionable insights. Our dashboards help business leaders make faster, clearer decisions with confidence.
Improved Productivity
Automate routine reporting, reduce manual work, and free up your team to focus on high-impact activities.
Cost Efficiency
Custom-built to your needs, not your budget cap. Our pricing is designed to deliver ROI, not generic software fees.
Centralized Data Management
Unify data from spreadsheets, tools, and systems into one powerful view. Eliminate silos and get the full story in one place.
Real-Time Insights
Stay in sync with what’s happening across your business live dashboards ensure you’re always a step ahead.
Scalability
Whether you’re 5 people or 500, our dashboards scale with your complexity without adding chaos.
05
From data discovery to dashboard delivery
Discovery
Set the foundation. Understand your goals, available data, and reporting needs. We map the first version of your Power BI vision.
Wireframing
Blueprint your insights. Visual prototype of key KPIs and user flows - ensuring everyone’s aligned before we build.
Development
Bring data to life. Dashboards, reports, and models are developed with best practices for UX, speed, and Power BI storytelling.
Refinement
Iterate and improve. We refine dashboards based on your feedback - enhancing clarity, usability, performance, and metric availability.
Delivery & Support
Stay supported. We deploy and stand by with ongoing support, updates, and quick resolutions to keep you confident. Trusted by 200+ Clients | 1000+ Projects Delivered Across 50+ Locations
06
Custom dashboard questions
What is WolfSight?
Which industries do you build dashboards for?
What tools are the dashboards built in?
Can the dashboards update automatically?
Get a Custom Dashboard for Your Business - Book Your Free Demo
Part of our KPI Dashboards and BI hub. Start with our KPI dashboard development.
KPI Dashboards and BI
More on KPI dashboard development
Power BI Consulting and Dashboard Development
Power BI consulting services: data models, DAX, dashboards, row-level security and migration from Excel or other BI tools, delivered by experienced consultants.
Looker Studio / Data Studio Agency
Why Your Business Needs a Looker Studio / Data Studio Dashboard How Businesses Like Yours Use Dashboards to Drive Results What Makes Our Dashboards a Growth Engine Enhanced Decision-Making Turn...
Case Study - Automation & Dashboard
Metric Before After Time to generate reports 4-5 hours < 5 minutes Reporting accuracy 75% 99% Visibility across insurers Limited Real-time with filters Impact Overview Faster, Smarter Decision...
BI Dashboard for Sustainability & ESG Reporting
BI Dashboard for Sustainability & ESG Reporting Sustainability Reporting Needs More Than Spreadsheets As ESG disclosures become mandatory in many industries, teams can no longer rely on siloed...
BI Dashboard for Supply Chain & Supplier Performance
BI Dashboard for Supply Chain & Supplier Performance Procurement and Supply Chain Need More Than Spend Reports Most supply chain teams track spend, but that’s just the surface. Real...