


Patient Journey Analytics: KPIs, Dashboards and How to Build It
Patient journey analytics for pharma: journey stages, 24 KPIs with formulas, four example dashboards, data sources and a step-by-step method to build it.
Get a free proposal
Tell us what you need. A consultant replies within one working day.
01
What is patient journey analytics?
Patient journey analytics is the practice of linking longitudinal patient-level data (claims, prescriptions, specialty pharmacy, hub and EHR records) to measure how patients move from symptoms and diagnosis through access, first fill, adherence, switching and discontinuation, and where and why they drop out.
For a pharma brand it turns a slide of arrows into numbers a team can manage: how many referred patients actually start therapy, how many days access takes, which payer or specialty pharmacy slows patients down, how long patients stay on treatment and what they switch to when they stop.
This guide covers the stages of the journey, the KPIs that measure each one (with formulas), four dashboards every brand and patient services team should have, the data sources behind them, and a practical method to build the capability. It is written by a team that came up through pharma commercial operations consulting and now builds these systems for specialty pharma brands. If you want the platforms and AI tools that support this work, see our patient journey analytics platforms guide.
02
The questions patient journey analytics answers
Good patient journey analytics starts from decisions, not data. The questions brand, market access, patient services and medical teams ask most often are:
- Diagnosis: how long does it take patients to get diagnosed, and which specialists diagnose them?
- Referral and initiation: how many diagnosed patients are referred, and how many of those start therapy?
- Access: how long do benefits verification and prior authorization take, how often are patients denied, and which payers and plans cause the delay?
- Fulfilment: which specialty pharmacies convert approved patients to a first fill fastest, and where do patients abandon?
- Adherence and persistence: what share of patients take their medicine as prescribed, and how many are still on therapy at 6 and 12 months?
- Switching and line of therapy: where do new patients come from, what do they switch to, and how does the brand perform in first, second and later lines?
- Programmes: do hub services, nurse support and copay programmes actually change outcomes?
03
The stages of the patient journey
1. Symptoms and diagnosis
From first symptoms to a confirmed diagnosis. In rare and specialty diseases this can take years and several specialists.
- Time to diagnosis
- Diagnosing specialty
- Claims and EHR data
2. Referral and treatment decision
The prescriber decides to treat and writes or refers the prescription, often through a hub enrolment form.
- Diagnosed to treated rate
- Referral volume by HCP
- Hub and CRM data
3. Access: BV and prior authorization
Benefits are verified, a prior authorization is filed, and some patients need an appeal or a bridge supply.
- BV turnaround
- PA approval and denial rate
- Hub case and payer data
4. Fulfilment and first fill
The specialty pharmacy schedules and ships the first fill. Patients who never receive it are abandoned.
- Time to therapy
- Abandonment rate
- Specialty pharmacy status data
5. Adherence
Whether patients take the medicine as prescribed, measured from refill timing.
- PDC and MPR
- Refill gap days
- Dispense data
6. Persistence and discontinuation
How long patients stay on therapy, when they stop and why.
- Persistence at 6 and 12 months
- Kaplan-Meier median
- Hub-reported reasons
7. Switching and line of therapy
What patients move to next, and how the brand performs as a first, second or later line.
- Switch rate and matrix
- Share by line
- Claims and APLD
8. Outcomes and restarts
Clinical and economic outcomes, re-starts after a gap, and the long tail of the journey.
- Restart rate
- Healthcare utilisation
- Linked EHR and claims
04
Patient journey KPIs, with formulas
Most disagreements between brand, access and finance teams come from the same KPI being defined three different ways. Agree the definitions first; the dashboards follow. These are the 24 KPIs we use most, grouped by stage.
| KPI | Definition or formula | Stage |
|---|---|---|
| Time to diagnosis | Median days from first related symptom or claim to confirmed diagnosis code | Diagnosis |
| Diagnosed to treated rate | Patients starting any therapy ÷ diagnosed patients, in a defined window | Decision |
| Referral volume | New prescriptions or hub enrolment forms received, by HCP and account | Referral |
| Referral concentration | Share of referrals from the top 10 or 20 percent of prescribers | Referral |
| Hub enrolment rate | Patients enrolled in the hub ÷ new patients referred | Referral |
| BV turnaround | Median days from referral received to benefits verification complete | Access |
| PA submission rate | Cases needing a PA where the PA was filed ÷ cases needing a PA | Access |
| PA approval rate | PAs approved (first pass) ÷ PAs decided | Access |
| Appeal overturn rate | Denials overturned on appeal ÷ denials appealed | Access |
| Time to therapy | Median days from referral received to first fill dispensed | Fulfilment |
| Referral to first fill conversion | Patients with a first fill ÷ referrals received, same cohort | Fulfilment |
| Abandonment rate | Approved or adjudicated prescriptions never picked up or shipped ÷ approved prescriptions | Fulfilment |
| Reversal rate | Pharmacy claims reversed after adjudication ÷ claims adjudicated | Fulfilment |
| NBRx | New to brand prescriptions in the period (new, switch-in and add-on patients) | Initiation |
| Source of business | Share of new brand patients who are new to market, switching in, adding on or restarting | Initiation |
| PDC | Days covered by dispensed supply ÷ days in the measurement period, capped at 100 percent; 80 percent or more is the usual adherent threshold | Adherence |
| MPR | Sum of days supply dispensed ÷ days between first fill and the end of the period (can exceed 1) | Adherence |
| Refill gap | Days between expected and actual refill date | Adherence |
| Persistence rate | Patients still on therapy at month N, with no gap longer than the allowed grace period ÷ patients who started | Persistence |
| Median time on therapy | Kaplan-Meier median duration from first fill to discontinuation | Persistence |
| Discontinuation rate | Patients who stop within the period ÷ patients on therapy at the start | Persistence |
| Restart rate | Discontinued patients who return to the brand within a window ÷ discontinued patients | Persistence |
| Switch rate | Patients moving to another therapy within N months ÷ patients on the brand | Switching |
| Share by line of therapy | Brand patients starting a given line ÷ all patients starting that line | Line of therapy |
Two choices change every number above, so write them down: the grace period that ends a treatment episode (often 1.5 times the days supply, or a fixed 30 to 90 days) and the cohort you measure (patients who started in a quarter, not everyone active in it). For more depth on the access stage, see our patient access KPIs and hub programme KPIs.
05
Dashboard 1: the patient journey flow
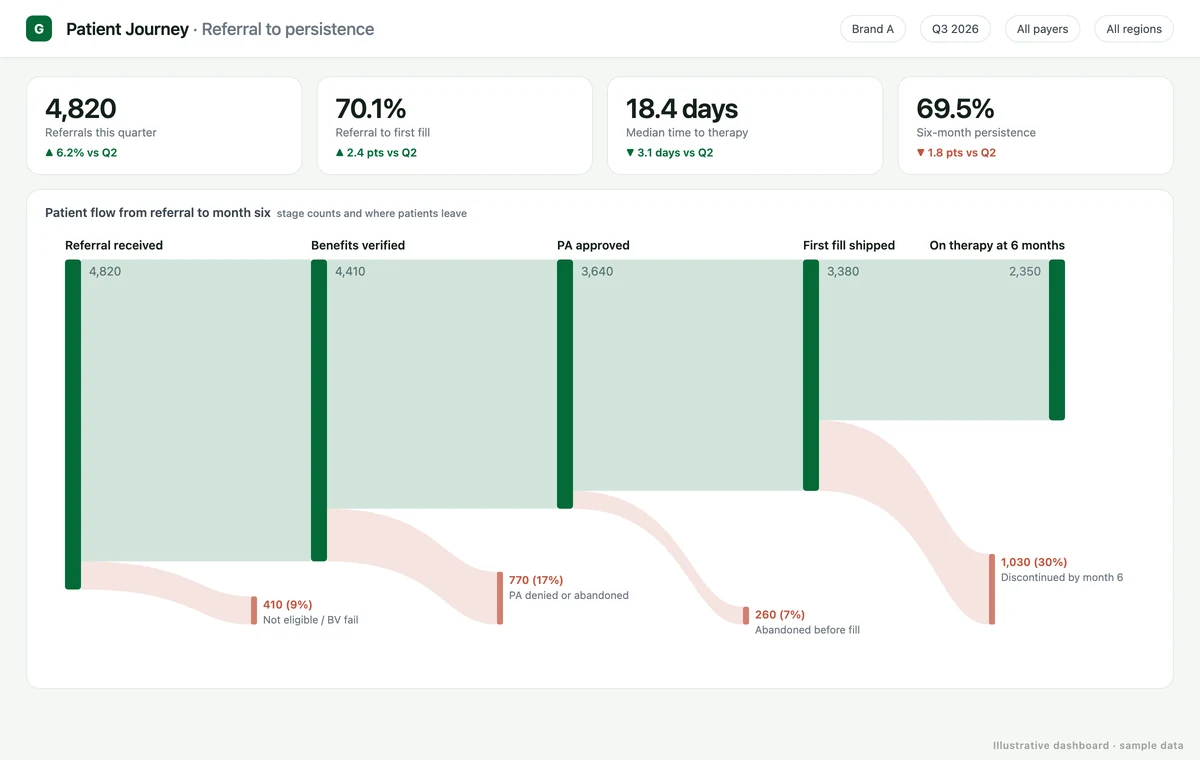
The first dashboard every brand needs shows the whole journey on one screen: how many patients enter at referral and how many remain at each stage, with the losses broken out. A Sankey view makes the largest leak obvious. In the example below, prior authorization loses more patients than any other access step, but the biggest single loss is discontinuation in the first six months.
Decisions it drives: where to put hub, field reimbursement and nurse resources; which stage to fix first; how to forecast patients on therapy from referral volume.
06
Dashboard 2: time to therapy
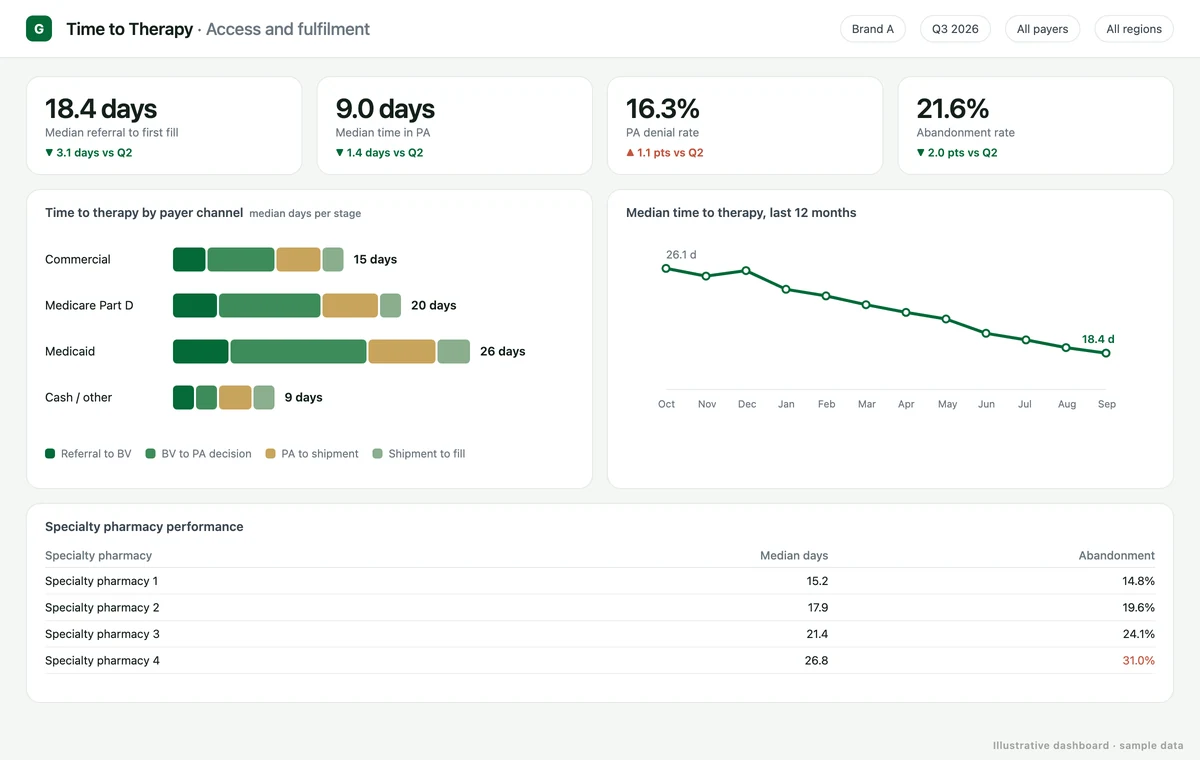
Time to therapy splits the access process into its stages (referral to benefits verification, BV to PA decision, PA to shipment, shipment to fill) and compares them by payer channel and specialty pharmacy. Medicaid and Medicare Part D patients usually wait longest, and one slow specialty pharmacy can carry most of the abandonment.
Decisions it drives: specialty pharmacy network design and service levels, where to offer bridge or quick-start supply, and which payers need field reimbursement attention.
07
Dashboard 3: adherence and persistence
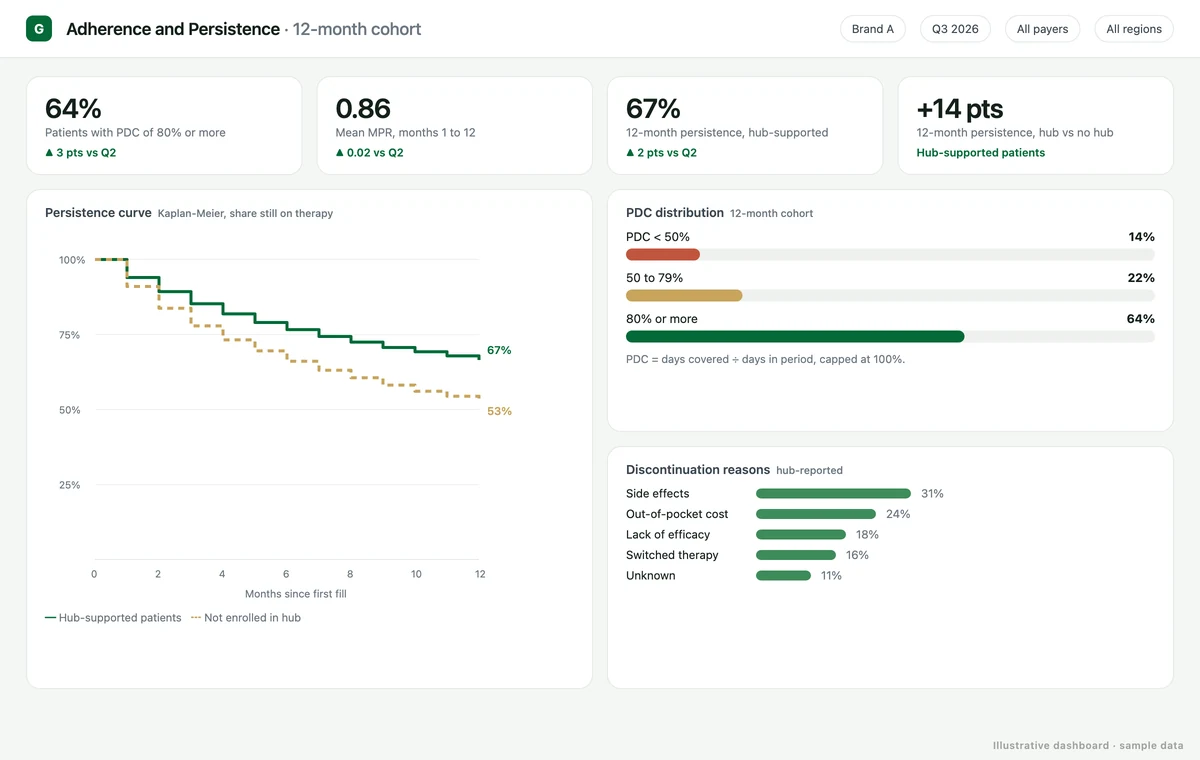
Adherence and persistence are different questions. Adherence (PDC or MPR) asks whether patients take the medicine as prescribed while they are on it; persistence asks how long they stay on it at all. A Kaplan-Meier persistence curve, split by a programme such as hub support, shows whether the programme is worth its cost. The PDC distribution shows how many patients sit below the 80 percent threshold, and hub-reported reasons explain the stops.
Decisions it drives: nurse and adherence programme targeting, copay assistance design, refill reminder timing, and the persistence assumption in the brand forecast.
08
Dashboard 4: line of therapy and source of business
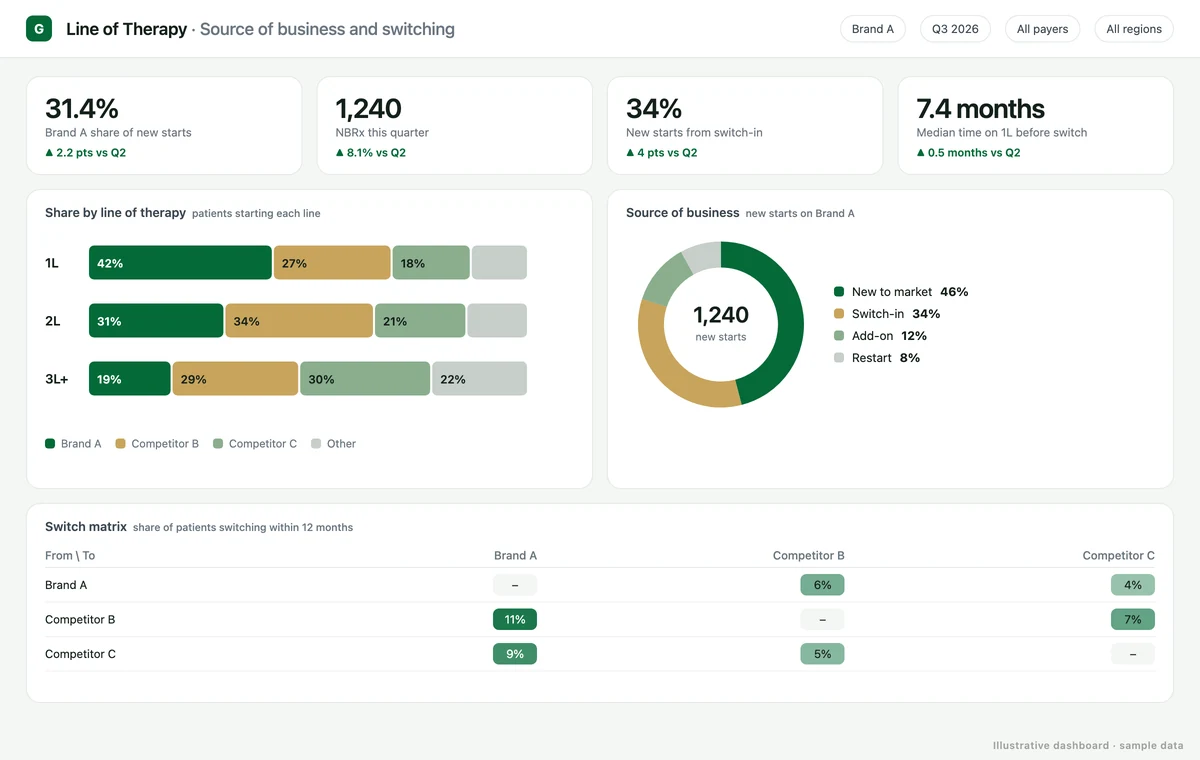
The last view places the brand in the treatment sequence: its share of patients starting first, second and later lines, where new patients come from (new to market, switching in, adding on or restarting), and a switch matrix that shows which competitor wins patients who leave. Line of therapy rules (when a new drug, a gap or a regimen change starts a new line) have to be agreed with medical colleagues before the numbers are trusted.
Decisions it drives: positioning by line, competitive messaging, launch tracking and the patient flow assumptions in the forecast.
09
Data sources for patient journey analytics
No single dataset covers the whole journey. Each source sees part of it, with its own lag and gaps, which is why linking them is most of the work.
| Source | What it adds | Watch out for |
|---|---|---|
| Open pharmacy and medical claims (APLD) | Broad, longitudinal view of diagnoses, procedures and prescriptions across payers | Incomplete capture for some channels; patients drop in and out of coverage |
| Closed (payer) claims | Complete history for enrolled members, good for persistence and costs | Smaller population, loses patients who change plans |
| Specialty pharmacy status and dispense data | Referral to first fill, status codes, shipment dates, refills | Different formats and status codes per pharmacy; files can arrive late |
| Hub and patient services data | Enrolment, BV, PA, appeals, programme touchpoints, discontinuation reasons | Free-text reasons; consent limits what can be linked |
| EHR and lab data | Symptoms, test results and clinical context before a prescription exists | Unstructured notes; uneven coverage across health systems |
| CRM call activity (Veeva or Salesforce) | Field and medical engagement with the prescribers in the journey | HCP identifiers must be mastered across sources |
| Payer and formulary data | Coverage, restrictions and PA criteria by plan | Plan-level detail changes often |
| Copay and affordability programme data | Out-of-pocket support and its effect on fills | Usually a separate vendor feed |
The sources are joined at patient level with privacy-preserving tokens, so the same patient can be followed across claims, specialty pharmacy and hub data without exposing identity. Prescribers and accounts are joined through a mastered HCP and HCO record. We describe the specialty pharmacy side in detail in our specialty pharmacy data analytics guide.
10
How to build patient journey analytics, step by step
Start from decisions
Write the five to ten questions the brand, access and patient services teams need answered each month. They decide which data you license and which KPIs you build.
Define the cohort and the journey
Agree the indication, the index event that starts a patient's journey, the stages and the events that move a patient between them.
Assemble and link the data
Bring claims, specialty pharmacy, hub and CRM data into one warehouse. Link patients with tokens and prescribers through a mastered HCP record.
Build the event table
One row per patient per event (diagnosis, referral, BV, PA, fill, refill, switch, stop) with dates and source. Every KPI is calculated from this table.
Write the KPI dictionary
Lock the formulas, grace periods, line of therapy rules and cohort logic, with an owner for each definition.
Validate against what teams already know
Reconcile counts with specialty pharmacy reports and finance numbers before anyone sees a dashboard.
Publish the dashboards
Journey flow, time to therapy, adherence and persistence, line of therapy. Refresh automatically on the data cadence.
Put it into the workflow
Alerts for stalled cases to the hub, at-risk patients to nurse programmes, and referral changes to the field. Analytics nobody acts on is a report.
11
Analysis methods that go beyond counts
Flow and funnel analysis
Sankey and funnel views of patient counts between stages, split by payer, region, pharmacy or HCP segment.
Time-to-event analysis
Kaplan-Meier curves and Cox models for time to therapy, persistence and time to switch, which handle patients still in progress correctly.
Line of therapy algorithms
Rules that turn a stream of claims into lines and regimens, the basis for share by line and switching analysis.
Patient archetypes
Clustering and sequence analysis that group patients by the paths they actually take, not the path in the brand plan.
Predictive risk scores
Models that flag patients likely to abandon or discontinue, early enough for the hub or nurse team to act.
Referral network analysis
Which prescribers diagnose, which refer and which treat, so field and medical teams engage the right people.
12
Common mistakes we see
13
Patient journey analytics vs patient journey mapping
The two are often confused. Journey mapping is qualitative and describes the experience; journey analytics is quantitative and measures it. Most brands need both, mapping first and analytics to keep it current.
| Patient journey mapping | Patient journey analytics | |
|---|---|---|
| Method | Interviews, workshops, market research | Linked patient-level data and statistics |
| Output | A visual map of stages, emotions and touchpoints | KPIs, dashboards, cohorts and risk scores |
| Refresh | Once, or every year or two | Weekly or monthly, automatically |
| Best for | Understanding why patients struggle | Measuring how many, how long and where, and tracking change |
14
How we handle patient data
15
How Greenwolf builds patient journey analytics
We are a senior-led team that builds the data layer and the dashboards: ingestion and validation of specialty pharmacy and hub feeds, patient linking, HCP and HCO mastering, the event table, the KPI dictionary and the dashboards your teams use every week. Our founder came up through pharma commercial operations consulting at ZS, so we start from the questions brand and access teams already ask.
In one engagement, a specialty therapy provider was rebuilding its patient access reporting by hand every cycle. We built clean identifiers and an MDM structure across sources, automated case pipelines and standardised reporting, and the team cut manual work by 60 to 80 percent with a clear view of the patient journey for leadership.
We work in the platforms you already run, including Snowflake, Databricks, Veeva, Power BI and Tableau. See also our pharma commercial analytics service and the wider pharma practice.
16
Patient journey analytics questions
What is patient journey analytics in pharma?
What data is used for patient journey analytics?
What are the most important patient journey KPIs?
What is the difference between adherence and persistence?
How do you calculate PDC?
What is line of therapy analysis?
How long does it take to build patient journey analytics?
Is patient journey analytics HIPAA compliant?
See your patient journey on one screen
Tell us which data you have today (specialty pharmacy, hub, claims or CRM) and the questions your team keeps asking. We will come back with what a first journey dashboard takes.
A reply from a consultant, usually within one working day.
Part of our Pharma Commercial and Patient Analytics hub. Start with our specialty pharmacy analytics.
Pharma Commercial and Patient Analytics
More on specialty pharmacy analytics
10 Best AI Tools for Patient Journey Analytics
Patient journey analytics platforms compared: 10 AI tools that map referral to refill, where each fits in pharma, and when to build your own.
Patient Access Dashboards: KPIs to Track Time to Therapy and Conversions
Patient Access Dashboards: KPIs to Track Time to Therapy and Conversions In today’s healthcare landscape where patient experience, treatment speed, and operational efficiency matter more than ever...
Understanding the Patient Journey in Specialty Pharma
Understanding the Patient Journey in Specialty Pharma In specialty pharmaceuticals, the patient journey represents the complete lifecycle a patient goes through from the moment a condition is...
Patient Analytics Dashboard: Turning Healthcare Data Into Actionable Intelligence
Patient Analytics Dashboard: Turning Healthcare Data Into Actionable Intelligence A patient analytics dashboard is a centralized, interactive reporting layer that consolidates clinical,...
Patient Access KPIs
This is where Patient Access KPIs (Key Performance Indicators) become essential. A well designed KPI set helps Market Access, Patient Services, and Commercial teams monitor the health of the...
Get started
Tell us where the week goes
Two weeks, fixed scope, a costed plan at the end. No obligation after it.
- We map your workflows and where the time actually goes
- You get the three that cost the most, with what automating them takes
- Delivered as a document, in 5 to 7 working days
Tell us where the week goes
A senior consultant will map where the time goes, name what is worth automating and what it takes. No obligation after it.