

Templates and trackers
ABC Chart and ABC Data Sheet: Antecedent, Behavior, Consequence
An ABC chart records the antecedent, behavior and consequence of each incident. Free printable ABC chart PDF, filled-in examples and how to analyze ABC data.
For BCBAs, RBTs and teachers
ABC Data Sheet and Analyzer
$9USD · one-time purchase · instant download
Record ABC data with dropdowns and short notes. The workbook counts antecedents, consequences, settings and times of day, and points to the most likely function.
- ABC log with dropdowns you can edit: antecedent, consequence, setting, likely function
- Summary with counts, percentages and charts by antecedent, consequence, function and setting
- Most likely function and top antecedent and consequence, calculated for you
- Scatterplot by 30-minute block and date with color shading
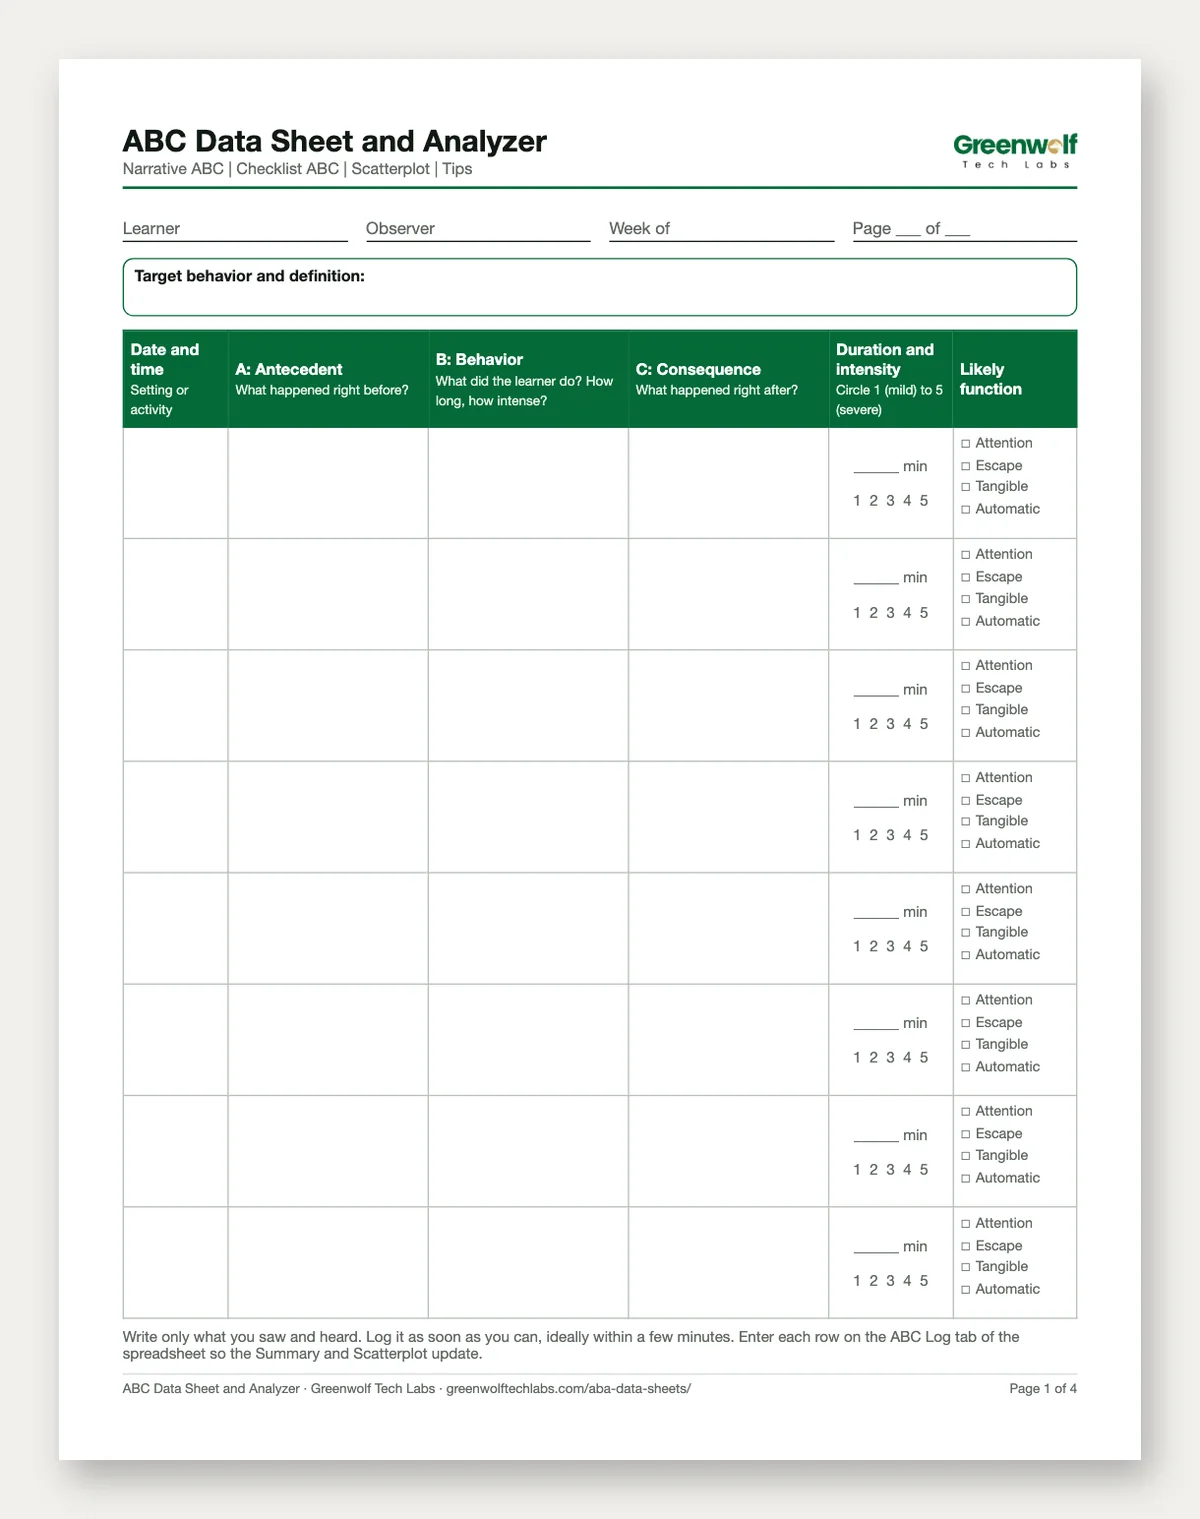
- Printable narrative ABC sheet, checklist ABC sheet and scatterplot sheet
You get: Excel workbook · Google Sheets-ready · Printable PDF
Secure checkout by Razorpay. Cards accepted worldwide, charged in US dollars. Files arrive on screen and by email. Refund policy
02
What is an ABC chart?
An ABC chart is an antecedent behavior consequence chart: a simple form where you write down what happened just before a behavior (A), exactly what the person did (B) and what happened right after (C). Over 10 to 15 entries, patterns appear that suggest why the behavior keeps happening.
Teachers, parents, RBTs and BCBAs use the ABC chart as the first step of understanding a behavior. It is the most common form of ABC data collection in applied behavior analysis (ABA) and a core part of a functional behavior assessment (FBA). An ABC behavior chart does not need special training to fill in, which is why it works at home, in a classroom and in a clinic.
Paper ABC data sheets are easy to start but hard to summarize. Our ABC Data Sheet and Analyzer gives you both: printable narrative, checklist and scatterplot sheets for the moment, and an Excel workbook (also works in Google Sheets) that counts antecedents, consequences, settings and times of day for you and shows the function your entries point to most often.
On this page: a free printable ABC chart, filled-in ABC chart examples, narrative vs checklist ABC, how to analyze ABC data to form a function hypothesis, the scatterplot, and how the chart changes between school, home and clinic.
03
Free printable ABC chart (PDF)
Download the free ABC data sheet PDF: the blank narrative ABC chart page from our kit, free to print and copy. It has space for the learner, observer, target behavior and definition, and a row per incident with date and time, antecedent, behavior, consequence, duration, a 1 to 5 intensity rating and a likely function check box (attention, escape, tangible, automatic).
The full ABC Data Sheet and Analyzer (above, $9) adds the checklist ABC sheet, the 14-day scatterplot sheet, a one-page guide to writing strong ABC entries, and the Excel workbook with dropdowns, a Summary tab with counts, percentages and charts, an antecedent by consequence grid, the most likely function calculated for you and a color-shaded scatterplot by 30-minute block.
04
ABC chart example: filled-in sample rows
The rows below are a sample for one learner, Sam (a made-up name), age 8, whose target behavior is "throwing materials: any time Sam throws or pushes classroom materials off the desk or onto the floor." Notice that every entry describes what a camera would record, not what Sam was feeling.
| Date and time | A: Antecedent | B: Behavior | C: Consequence | Likely function |
|---|---|---|---|---|
| Mon 9:05 AM, math | Teacher put a 10-problem worksheet on the desk and said "Start with number 1." | Said "no," pushed the sheet to the floor, cried for about 4 minutes. Intensity 3. | Teacher picked up the sheet, said "We can try later" and moved on. Sam stopped crying within a minute. | Escape |
| Mon 10:40 AM, centers | Bell rang for transition from blocks to reading table. | Threw two blocks toward the shelf. Intensity 2. | Aide walked over, said "Blocks are done," and gave Sam 2 more minutes. | Tangible |
| Tue 9:10 AM, math | Teacher handed out a subtraction page and said "Work quietly." | Swept pencil box and page off the desk. Intensity 3, 2 minutes. | Sent to the calm corner for 5 minutes; the page was not finished. | Escape |
| Wed 1:15 PM, reading | Teacher was working with another group for 10 minutes. | Threw a book onto the floor and looked at the teacher. Intensity 1. | Teacher came over and said "Sam, we do not throw books." | Attention |
| Thu 9:00 AM, math | Teacher said "Take out your math book." | Pushed math book off the desk and put head down. Intensity 2. | Teacher said "Let's start with something easier" and gave a coloring page. | Escape |
Even five sample rows show a pattern: three of five start with a math demand and end with the work being removed, delayed or replaced. That is a hint, not a conclusion. Keep collecting and see whether the pattern holds across days and staff.
05
Narrative vs checklist ABC chart (and when to use a scatterplot)
There are three common ABC data collection formats. Most teams use more than one: a narrative chart early on, a checklist once the common antecedents and consequences are known, and a scatterplot alongside both.
| Format | What you record | Best for | Watch out for |
|---|---|---|---|
| Narrative ABC chart | A few sentences in each of the A, B and C columns | A new behavior, the first week of an FBA, or when you do not yet know the likely triggers | Slow to write; vague or inconsistent wording; hard to count later |
| Checklist ABC data sheet | Tick boxes for common antecedents (demand, transition, told no, alone) and consequences (task removed, attention, item given, planned ignoring) | Busy classrooms, multiple observers and anyone who needs a 20-second entry | Can miss a trigger that is not on the list; always keep an "Other" line |
| Scatterplot | Whether the behavior happened (and how often) in each time block across many days | Finding when behavior clusters so you know where to focus ABC recording | Shows timing, not causes; needs consistent recording every block |
The kit uses a hybrid: the printable sheets cover all three formats, and in the workbook you pick a category from a dropdown and add a short note, so entries stay countable without losing detail.
06
How to fill in an ABC chart, step by step
Write an operational definition first
Define the target behavior so two observers would agree on every instance, for example "throwing materials: any time the learner throws or pushes classroom materials off the desk." Write it at the top of the ABC data sheet.
Record every incident, as soon as you can
Log each episode in the observation window, not only the big ones. Jot a few words right away and finish the row at the next break; memory shifts within the hour.
Capture the A at the right moment
The antecedent is what changed in the seconds or minutes before: an instruction (write the exact words), a transition, an item removed, attention moving to someone else. Add the setting and activity.
Make the B observable and measurable
Describe actions, not feelings. Add duration and an intensity rating. If two behaviors happened, write two rows.
Report every part of the C
Write what adults and peers did right after, and what the learner got or avoided. Did the task go away? Did someone come over? Was an item handed back? This is the column most often left thin.
Review the pattern after 10 to 15 incidents
Tally antecedents, consequences and times of day, then form a hypothesis about function with your supervising BCBA. The workbook does the tally for you on the Summary tab.
07
How to analyze ABC data and hypothesize the function
ABC data is descriptive: it shows what tends to happen around a behavior, not proof of what causes it. Its job is to produce a hypothesis about the function of the behavior, which a BCBA then tests as part of the FBA. Behavior analysts usually group functions into four categories:
| Function | What the C column usually shows | Typical A column |
|---|---|---|
| Attention | Someone looks, talks, reprimands or comes over | Adult busy with others, learner alone, low attention |
| Escape | A task, demand, person or setting goes away or is delayed | Demand or task given, hard work, transition to a non-preferred activity |
| Tangible | The learner gets an item or activity, or gets it back | Preferred item removed, told no, waiting, end of a preferred activity |
| Automatic | Nothing in the environment changes; it happens even when alone | No clear trigger; free time, low stimulation |
Worked example (sample data). After two weeks, Sam's ABC chart has 12 incidents. Tallying the columns:
- Antecedents: demand or task given 8 (67%), transition 2 (17%), told no 2 (17%).
- Consequences: task removed or delayed 7 (58%), adult attention 3 (25%), item given 2 (17%).
- Antecedent by consequence: 6 of the 8 demand incidents ended with the task removed or delayed.
- Time of day: 9 of 12 incidents fell between 9:00 and 10:00 AM, the math block.
The pattern "demand, then the work goes away" points to escape as the most likely function, with math as the main setting. A reasonable next step is to share this with the BCBA, who may confirm it with more assessment and then build a plan around it (for example, teaching Sam to ask for a break and adjusting task difficulty). Our FBA and BIP template kit takes the hypothesis from here into a written plan.
In the workbook, this whole analysis is automatic: the Summary tab shows counts and percentages by antecedent, consequence, function and setting, a dark cell in the A x C grid flags the same trigger followed by the same outcome, and a single cell shows the function you tagged most often. Treat that cell as a guide to discuss with your supervising BCBA, not as an FBA.
08
The scatterplot: find when the behavior happens
A scatterplot data sheet answers a different question from the ABC chart: when does the behavior occur? The day is split into time blocks (our printable sheet runs 7:00 AM to 7:30 PM in 30-minute blocks across 14 days), and you shade each block by how often the behavior happened: blank for none, light for 1 to 2 times, dark for 3 or more, or write the count.
After a week or two, dark bands show the times and activities where behavior clusters, such as the first block after arrival, a particular lesson or the hour before dinner. Use those bands to decide where to run detailed ABC recording, and to compare against the schedule: what demands, people or transitions are present at those times? The workbook builds the same scatterplot automatically from your ABC log, shaded by count.
09
ABC chart for school and home vs the clinic
The ABC chart is the same idea everywhere, but who fills it in and what they need from it changes.
| Setting | Who records | What works best | Tip |
|---|---|---|---|
| School and classroom | Teachers, aides, special education staff | Checklist ABC sheet on a clipboard plus a scatterplot by class period | Add the class or subject to every row; patterns often follow the timetable. |
| Home | Parents and caregivers | Narrative ABC chart kept in the kitchen, filled in after each incident | Note who was present, sleep, hunger and routine changes; share the chart with school staff and the BCBA. |
| ABA clinic or in-home sessions | RBTs and BCBAs | Checklist ABC with a consistent category list, entered into the workbook the same day | Use the same categories for every observer so the Summary tab compares like with like. |
When home and school both keep ABC data with the same categories, you can see whether a behavior is tied to a setting or follows the learner everywhere, which is useful for the BCBA.
10
Common ABC data collection mistakes
- Interpreting instead of describing. "Got frustrated" or "was being manipulative" is a guess. "Pushed the worksheet off the desk and said no" is data.
- A thin consequence column. "We dealt with it" tells you nothing. Write what adults did and what the learner got or avoided.
- Only logging the big incidents. Skipping small episodes skews the pattern toward the dramatic days.
- Not logging quiet times. Knowing when the behavior does not happen is as useful as knowing when it does.
- Deciding too early. Three entries are a story, not a pattern. Aim for 10 to 15 incidents across several days and settings.
- Different words for the same thing. One observer writes "meltdown," another "tantrum," a third "refusal." Use one operational definition and one category list.
- Treating the chart as the FBA. ABC data suggests a function. A BCBA confirms it before a behavior plan is written.
Need to measure how often or how long the behavior happens as well? Pair the ABC chart with our behavior tracking sheet and behavior chart kit for frequency, duration and latency graphs, and see the full set of ABA data sheets. To reinforce the replacement behavior once you know the function, the token board kit helps.
11
ABC chart and ABC data sheet questions
What is an ABC chart in behavior?
What does ABC stand for in ABA?
Where can I get a free ABC data sheet PDF?
What is the difference between a narrative and a checklist ABC chart?
How many ABC entries do I need before I can see a pattern?
How do you analyze ABC data?
Does the ABC data sheet tell me the function of the behavior?
Can parents and teachers use an ABC behavior chart?
Does the ABC data sheet work in Google Sheets, and can I edit the categories?
12
More BCBA trackers
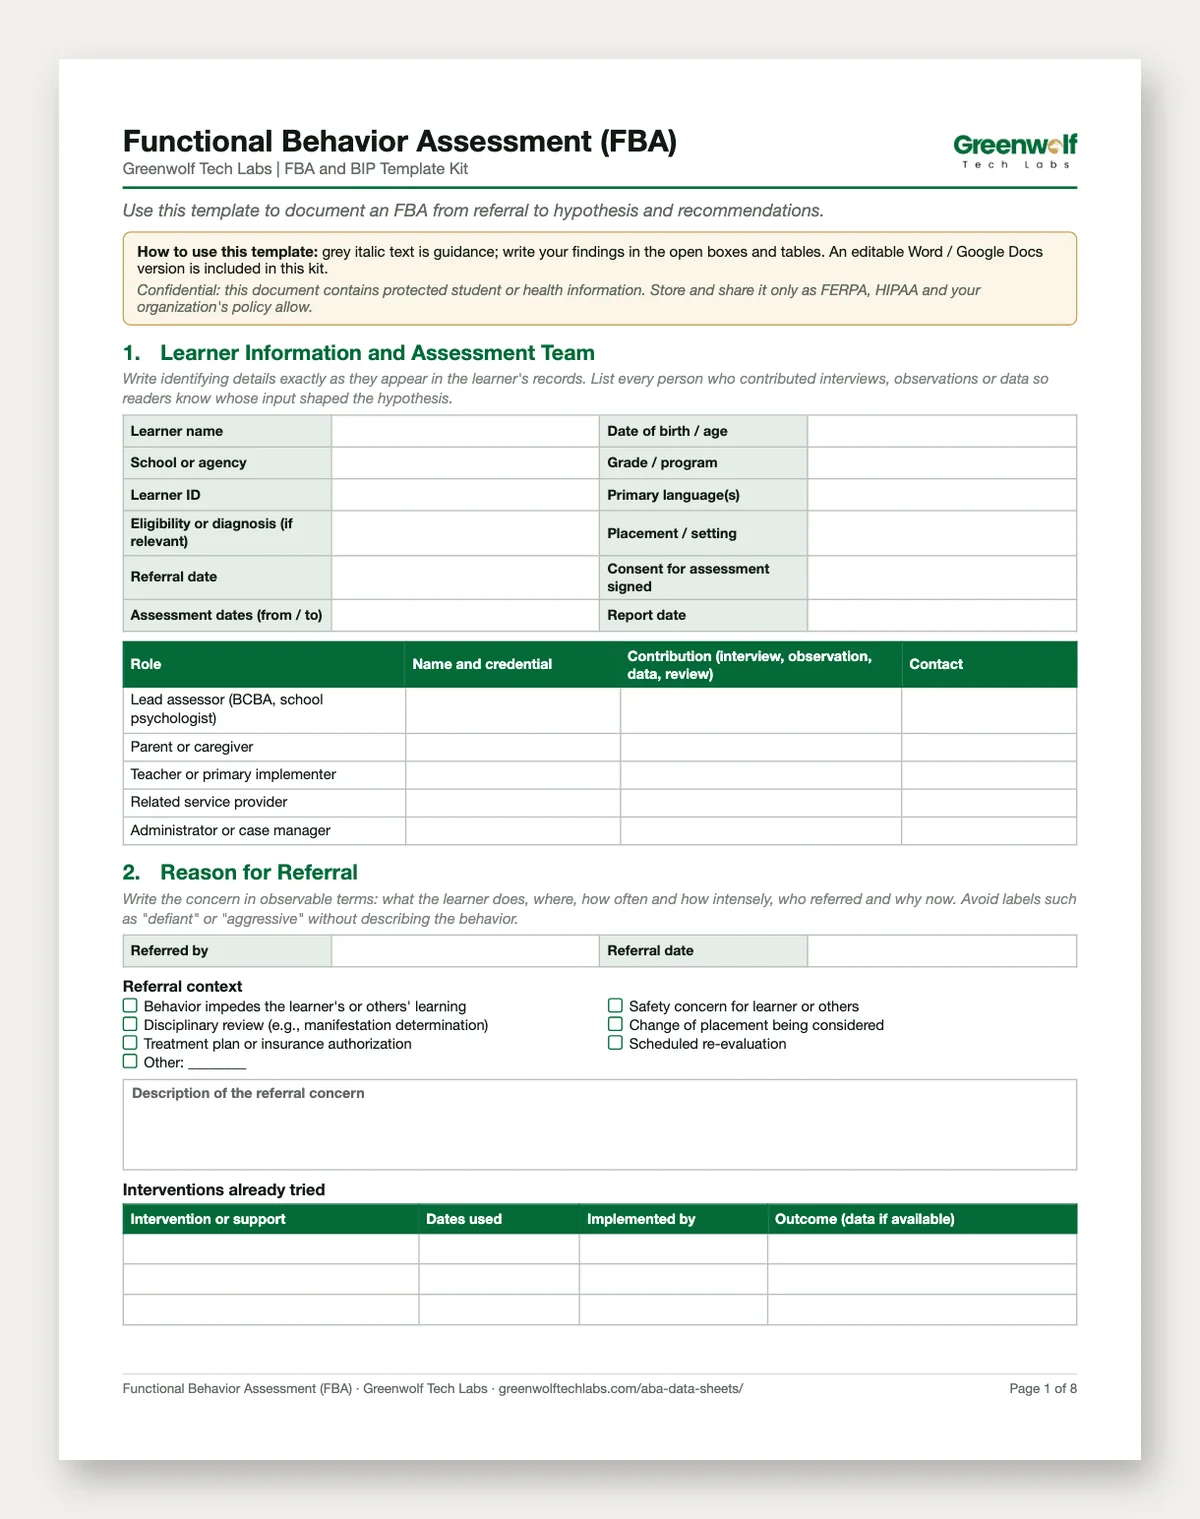
FBA and BIP Template Kit
Editable FBA and BIP templates with a hypothesis matrix and fidelity checklist.
$19Details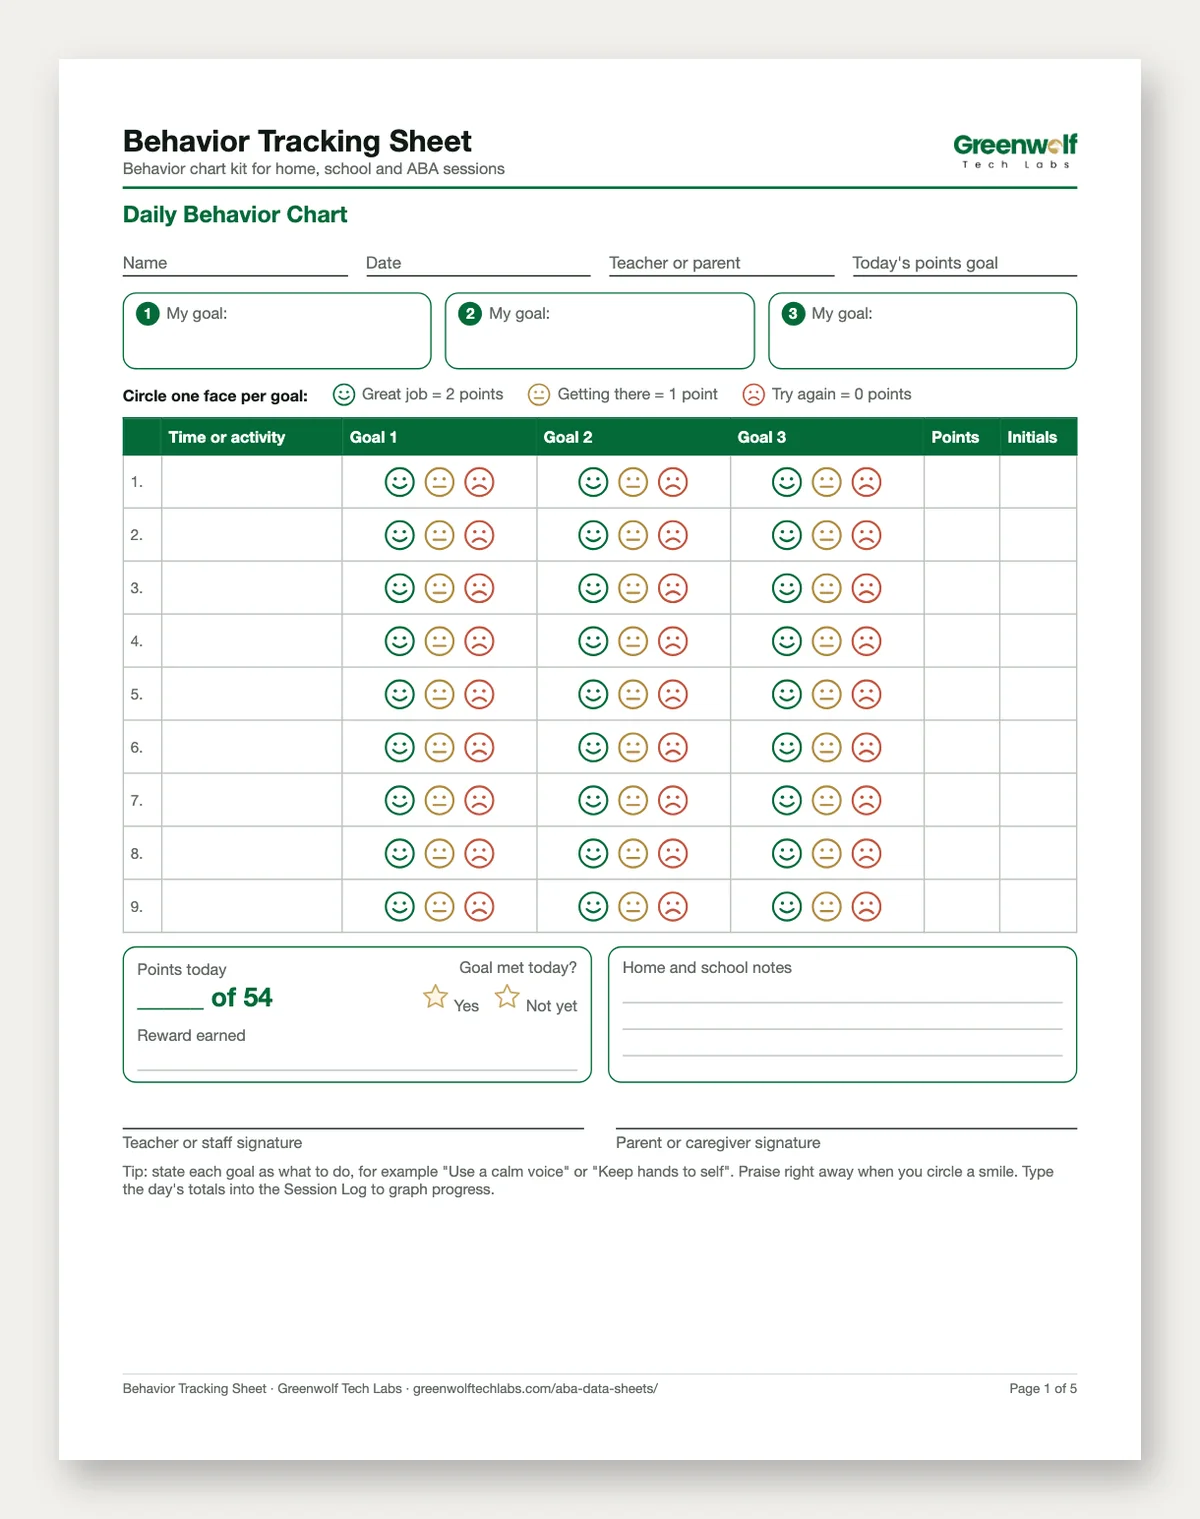
Behavior Tracking Sheet and Behavior Chart Kit
Frequency, duration and latency with automatic rates and graphs.
$12Details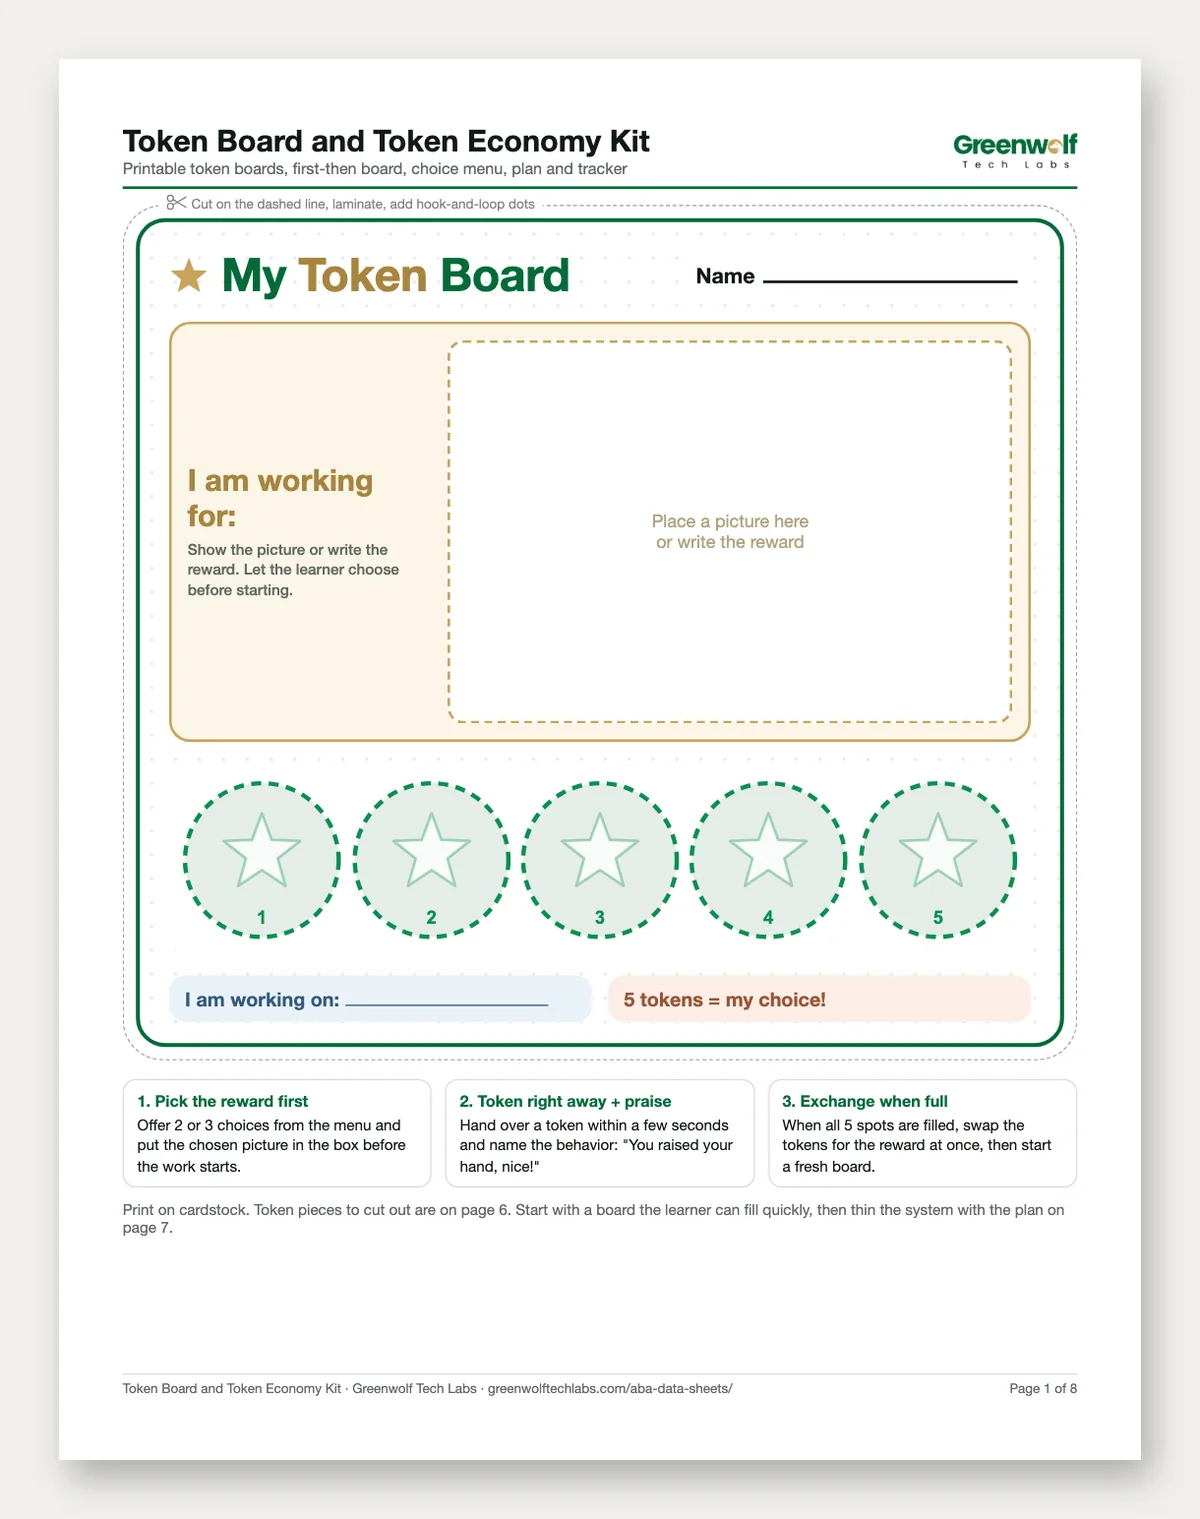
Need this inside your practice software?
We build ABA data collection and practice management systems around how your clinic works, so data like this is captured once and reported automatically.
Part of our Healthcare Practice Automation hub. Start with our healthcare workflow automation.
Healthcare Practice Automation
More on healthcare workflow automation
Printable Behavior Chart, Behavior Log and Tracking Sheet
Free printable behavior chart for kids at home and school, plus a behavior log and tracking sheet with frequency, duration and latency formulas and graphs.
Link EMR/EHR Data with Insurance Claims Through Automation
Link EMR/EHR Data with Insurance Claims Through Automation Healthcare providers and insurers often face the challenge of fragmented data. While Electronic Medical Records (EMR) and Electronic...
ABA Data Collection Software, Built Around Your Clinic
Custom ABA data collection software for BCBAs and RBTs: session data on any device, automatic graphs, notes and authorizations in one system your clinic owns.
ABA Data Sheets and BCBA Trackers
Free ABA data sheets plus BCBA trackers that calculate and graph: ABC, frequency, duration, latency, token boards, fieldwork, RBT competency, FBA and BIP.
BIP and FBA Templates with Examples and a Competing Behavior Pathway
Editable BIP and FBA templates in Word and PDF, with a worked FBA-to-BIP example, a competing behavior pathway and hypothesis statements for each function.