

Templates and trackers
Printable Behavior Chart, Behavior Log and Tracking Sheet
Free printable behavior chart for kids at home and school, plus a behavior log and tracking sheet with frequency, duration and latency formulas and graphs.
For BCBAs, RBTs, teachers and parents
Behavior Tracking Sheet and Behavior Chart Kit
$12USD · one-time purchase · instant download
Log behavior once and get rates per hour, weekly averages and a graph for every behavior, with baseline and intervention phases. Print the charts for home and school days.
- Up to 5 behaviors, each measured by frequency, duration or latency
- Rate per hour from observed time, so short and long sessions compare fairly
- Graphs by phase with a goal line, updated as you log
- Weekly report: change against last week and against baseline
- Printable daily and weekly behavior charts, tally, duration and graph sheets
You get: Excel workbook · Google Sheets-ready · 5-page printable PDF
Secure checkout by Razorpay. Cards accepted worldwide, charged in US dollars. Files arrive on screen and by email. Refund policy
02
What is a printable behavior chart?
A printable behavior chart is a paper grid where a parent or teacher marks, period by period, how a child did on two or three clear goals, such as "keep hands to self." Points or stars add up to a daily goal and a reward, so good behavior gets noticed.
A behavior chart is for the child: it motivates and gives quick feedback. A behavior log or behavior tracking sheet is for the adults: it records how often a behavior happened, how long it lasted or how long it took to start, so you can see whether things are actually improving. This kit has both, so the same day can be a sticker on the fridge and a data point on a graph.
On this page: a free printable behavior chart, how to use a behavior chart for kids at home and at school, how to set goals that work, the difference between a behavior log and a tracking sheet, frequency, duration and latency data sheets with formulas, how to graph behavior with baseline and intervention phases, and real-world examples.
03
Free printable behavior chart (PDF)
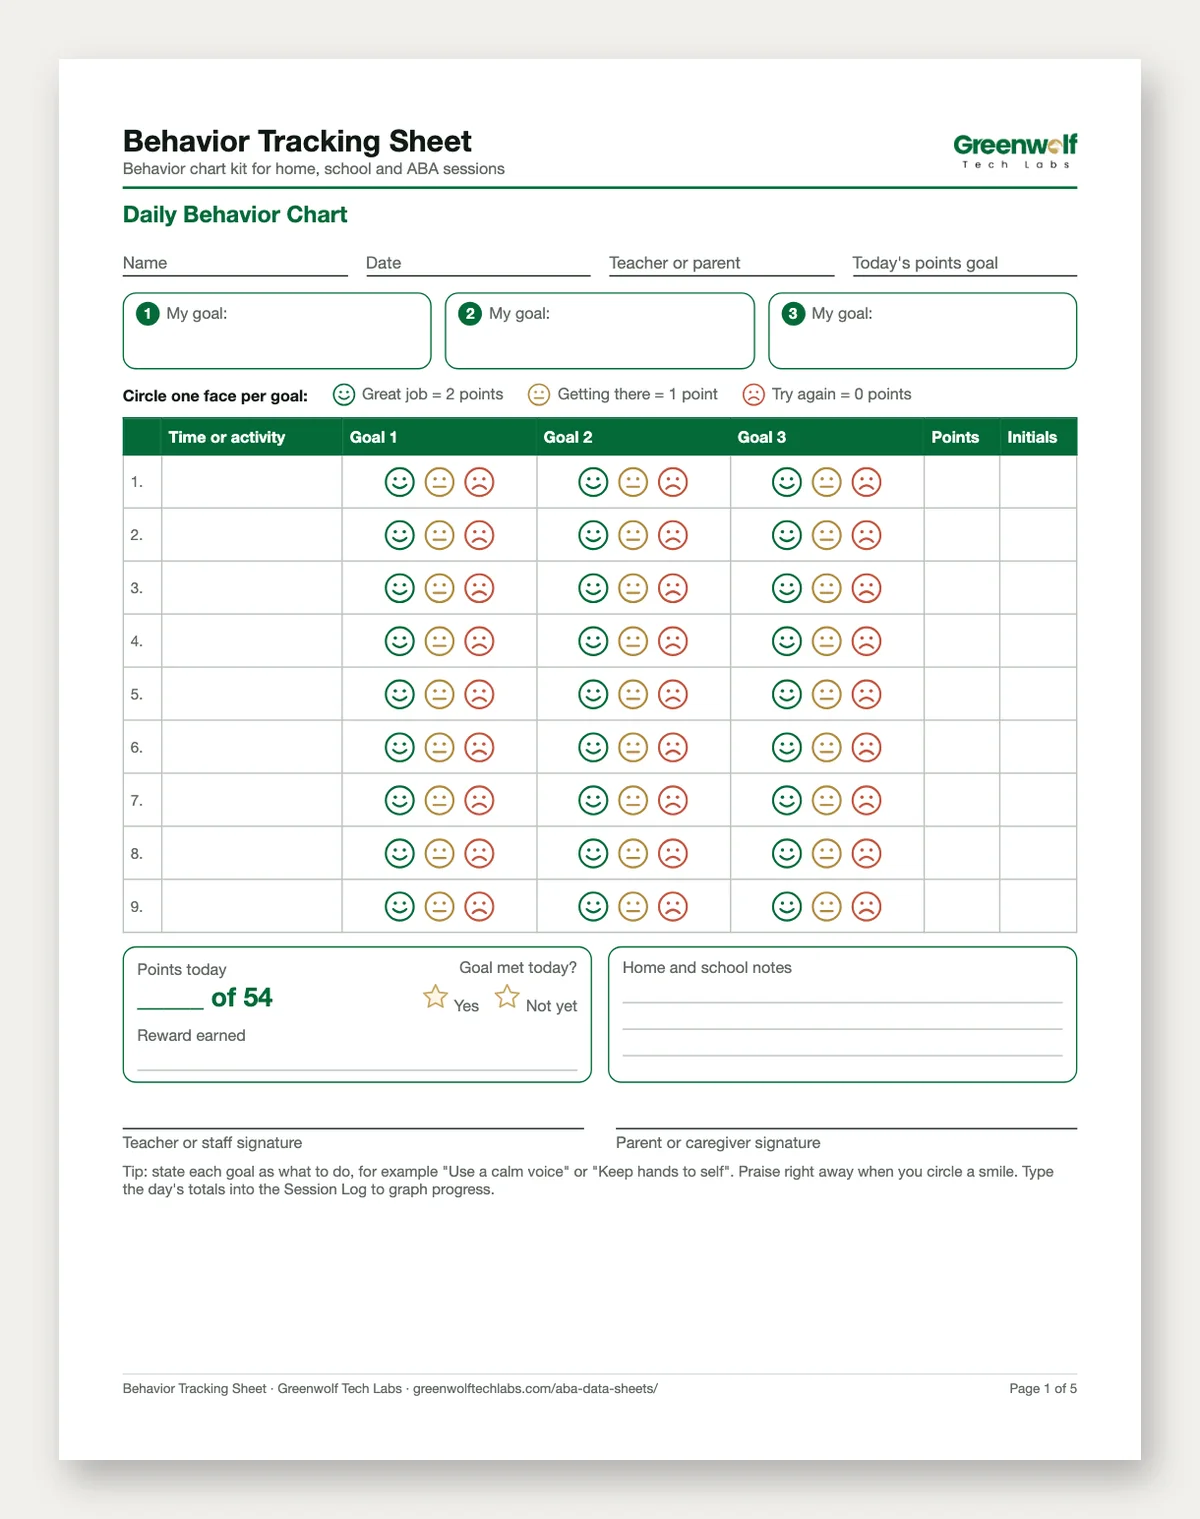
Download the free printable daily behavior chart, the first page of our kit, free to print and copy. It has three "My goal" lines, nine time or activity rows, faces to circle for each goal (Great job = 2 points, Getting there = 1, Try again = 0), a points total out of 54, a daily points goal, a reward line, home and school notes, and teacher and parent signatures so the chart can travel in the backpack.
The full Behavior Tracking Sheet and Behavior Chart Kit (above) adds a weekly star chart, a frequency (tally) data sheet, a duration and latency data sheet, behavior graph paper with phase lines, and an Excel workbook (also works in Google Sheets) that turns your log into rates per hour, weekly averages and a graph for up to five behaviors, with baseline and intervention phases and a goal line.
04
Behavior chart for kids at home and at school
The same chart works in both places if the goals, points and reward are agreed between the adults. Match the format to the child:
| Age or need | Chart that fits | Goals | Rewards |
|---|---|---|---|
| Preschool (about 3 to 5) | Picture or sticker chart, a few short periods | 1 or 2, stated very simply ("gentle hands") | Small and same day: a sticker, a song, extra story |
| Early elementary (about 5 to 8) | Daily behavior chart with faces and points | 2 or 3 goals, checked each period or activity | Daily choice from a short reward menu |
| Older kids and preteens | Weekly star chart or points chart | 3 or 4 goals, with the child helping to set them | Weekly privilege or activity, earned by a points total |
| Learners in ABA or with an IEP or BIP | Daily chart for the learner plus a tracking sheet for the team | Goals taken from the behavior plan | As set in the plan; often a token board |
At home, put the chart where everyone sees it (the kitchen is common), go through it at the same time each day and praise specific actions as you mark them. At school, rows usually follow the timetable (arrival, reading, math, lunch, recess), the teacher marks each period and the chart goes home for a parent signature. A home and school chart works best when both sides use the same goals and wording.
05
How to set goals and use a behavior chart
Pick 2 or 3 goals, phrased as what to do
"Use a calm voice" and "Keep hands to self" tell the child what success looks like. "Don't yell" only says what not to do. Each goal should be something you can see and mark yes or no.
Split the day into short periods
Use activities or time blocks the child understands, such as morning routine, school, homework, dinner and bedtime at home, or the class timetable at school. Shorter periods mean more chances to succeed.
Set a daily goal the child can reach
Start the target near what the child already earns, then raise it. If points are always far out of reach, the chart stops working.
Agree the reward together
Let the child choose from a short menu: extra screen time, choosing dinner, a park trip. Rewards do not need to cost money; they need to matter to the child.
Mark and praise right away
Circle the face at the end of each period and say exactly what went well. Immediate feedback is what makes the chart work.
Review weekly, then raise the bar or fade the chart
Once goals are met most days, raise the target, swap in a new goal or move from daily to weekly charts. Type daily totals into the Session Log to see the trend on a graph.
06
Worked example: one week with the daily chart
This is a sample scenario. Maya, 7, has three goals: "Start work when asked," "Use a calm voice" and "Keep hands to self." Her school day has 9 periods, so the most she can earn is 9 periods x 3 goals x 2 points = 54 points. In the first week she averaged 30 points a day, so her parents and teacher set the daily goal at 36 points (two-thirds of 54) with a reward of choosing the family game.
| Day | Points | % of 54 | Goal of 36 met? |
|---|---|---|---|
| Mon | 32 | 59% | Not yet |
| Tue | 37 | 69% | Yes |
| Wed | 40 | 74% | Yes |
| Thu | 35 | 65% | Not yet |
| Fri | 42 | 78% | Yes |
Maya met the goal on 3 of 5 days and her average rose from 30 to 37.2 points. The notes show Thursday's low score came after a substitute teacher, which is useful context. Next week the goal stays at 36; once she meets it on 4 of 5 days, it moves to 40.
The weekly star chart works the same way: up to 4 goals, 7 days and up to 3 stars a day gives a maximum of 84 stars (4 x 7 x 3). For a 5-day school week, cross out Saturday and Sunday and set the weekly goal out of 60.
07
Behavior log vs behavior tracking sheet vs behavior chart
These three terms are often used for the same thing, but they do different jobs. Use this table to pick the right behavior data sheet:
| Tool | Who it is for | What it records | Use it when |
|---|---|---|---|
| Behavior chart | The child | Points, faces or stars against 2 to 4 goals per period | You want to motivate and give feedback at home or in class |
| Behavior log | Parents, teachers, staff | A dated entry for each incident: time, what happened, what was done | You need a running record of incidents to share with the school, a doctor or a BCBA |
| Behavior tracking sheet | Teachers, RBTs, BCBAs | Counts, durations or latencies for a defined behavior, with observation time | You need to measure change and graph it (baseline vs intervention) |
| ABC chart | Teachers, RBTs, BCBAs, parents | Antecedent, behavior and consequence of each incident | You want to understand why a behavior happens; see our ABC chart and data sheet |
08
Frequency, duration and latency data sheets, with formulas
A behavior tracking chart is only as good as its measure. Choose the one that matches what matters about the behavior, and always write down how long you observed.
| Measure | Use for | Formula | Sample calculation |
|---|---|---|---|
| Frequency (count) | Behaviors with a clear start and end that happen often: hitting, calling out, hand raising | Count of occurrences in the session | 6 tallies in a session |
| Rate per hour | Comparing sessions of different lengths | Rate = count / (minutes observed / 60) | 6 tallies in 90 minutes = 6 / 1.5 = 4.0 per hour |
| Duration | Behaviors that last a while: tantrums, crying, on-task time | Total duration = sum of episode times; mean per episode = total / episodes | 3 tantrums of 4, 7 and 4 minutes = 15 min total, 5 min mean |
| % of session | Showing how much of the session the behavior took up | % = total duration / minutes observed x 100 | 15 min in a 60-minute session = 25% |
| Latency | How long it takes to start after an instruction: starting work, following a direction | Mean latency = sum of latencies / number of trials | Latencies of 40, 25, 70 and 45 seconds = 180 / 4 = 45 seconds |
The kit has a frequency data sheet (tally) with a rate per hour column and a phase box (B, I or M for baseline, intervention, maintenance), and a duration data sheet with a latency section on the same page. In the workbook, enter count, duration or latency in the Session Log and it calculates the rate per hour, daily summary and weekly change for you.
09
How to graph behavior with baseline and intervention phases
A behavior graph turns a stack of data sheets into a clear answer: is the plan working? Use a line graph with sessions (or dates) along the bottom and the measure (rate per hour, minutes or seconds) up the side.
- Write a y-axis scale that fits your highest value.
- Plot one dot per session and connect the dots within a phase.
- Draw a dashed vertical line where the intervention starts and label each phase at the top. Do not connect dots across a phase line.
- Draw the goal as a horizontal dashed line.
Sample data. Calling out, measured as rate per hour:
| Phase | Sessions 1 to 5 (rate per hour) | Mean |
|---|---|---|
| Baseline | 6.0, 5.3, 6.7, 5.0, 6.0 | 5.8 |
| Intervention | 4.0, 3.3, 2.7, 2.0, 1.3 | 2.7 |
The baseline is steady around 6 per hour; after the phase line the trend drops each session, and the mean falls by more than half. If the goal line were 2 per hour, the team would keep going until several sessions in a row sit at or below it, then plan a maintenance phase. The workbook draws this graph automatically for each behavior, with baseline, intervention and maintenance in different colors and your goal line; the printable graph paper lets you do the same by hand.
10
Behavior chart examples
- Morning routine at home: goals "Get dressed by 7:30," "Eat breakfast at the table," "Shoes and bag by the door." Rows: wake up, dressing, breakfast, leaving.
- Classroom chart: goals "Start work when asked," "Raise hand to talk," "Stay in my area." Rows follow the timetable; the teacher circles a face each period.
- Bedtime chart: goals "Bath when asked," "Teeth brushed," "Stay in bed after lights out." A weekly star chart works well here.
- Homework chart for an older child: goals "Start within 5 minutes," "Finish before screen time." Track the start delay as latency to see it shrink.
- ABA session: the learner sees a daily chart or token board; the RBT records frequency of the target behavior on the tally sheet, and the BCBA reviews the graph weekly.
11
Common behavior chart and tracking mistakes
- Too many goals. Five goals on a chart for a 6-year-old is a list of ways to fail. Start with two or three.
- Vague goals. "Be good" cannot be marked fairly. Name the action.
- Taking points away. Removing earned points can turn the chart into a punishment. Keep it about what the child earns.
- Rewards too far away. A reward at the end of the month is too distant for young children; use daily or weekly rewards.
- Counts without observation time. 6 incidents in 30 minutes and 6 in 3 hours are very different. Record minutes and use rate per hour.
- No baseline. Track for a few sessions before starting the plan, or you cannot tell whether it worked.
- Connecting dots across a phase change. It hides the effect of the intervention on the graph.
- Home and school using different rules. Agree the goals and wording so the child gets one consistent message.
If you need to know why the behavior happens, start with the ABC data sheet and analyzer; when a written plan is next, the FBA and BIP template kit covers it. See all six kits on the ABA data sheets page.
12
Behavior chart and behavior tracking questions
Where can I get a free printable behavior chart?
What should I put on a behavior chart for kids?
What is the difference between a behavior log and a behavior tracking sheet?
What is the difference between a behavior chart and a behavior tracking sheet?
How do you calculate rate on a frequency data sheet?
When should I use a duration data sheet instead of frequency?
How do you make a behavior graph?
Do behavior charts work for kids with ADHD or autism?
Does the behavior tracking sheet work in Google Sheets?
13
More BCBA trackers
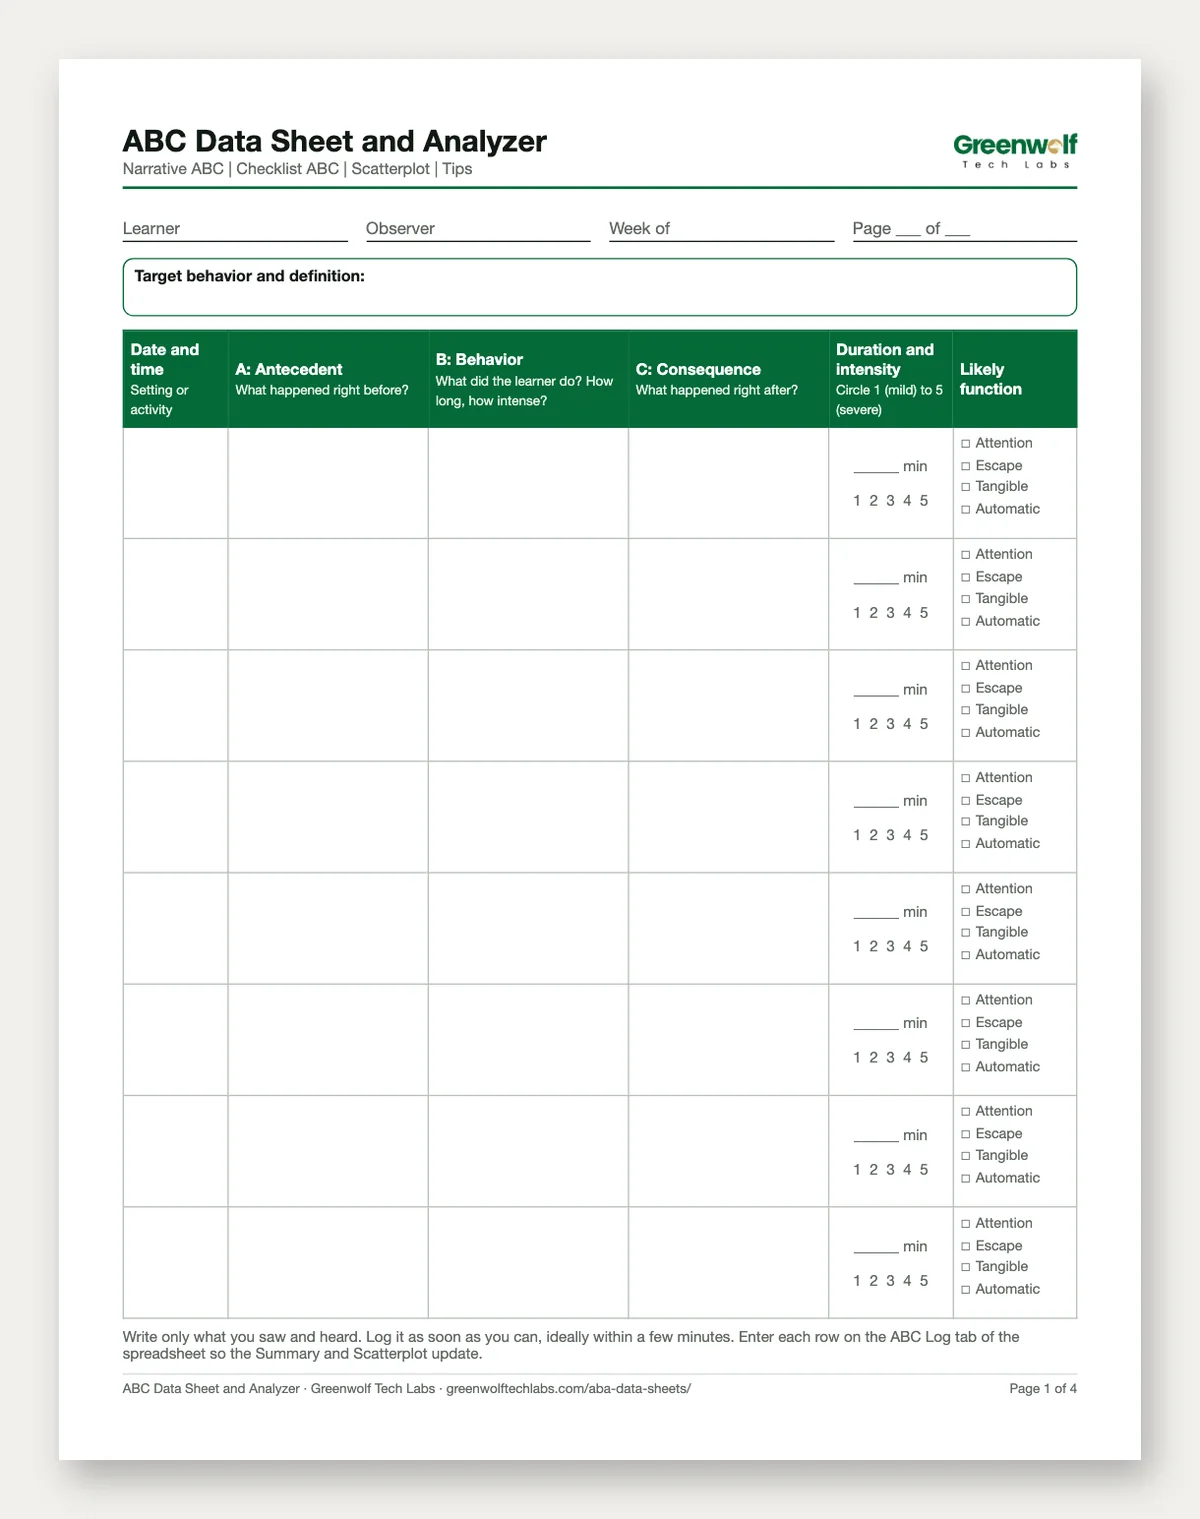
ABC Data Sheet and Analyzer
ABC logging that finds the top antecedents, consequences and likely function.
$9Details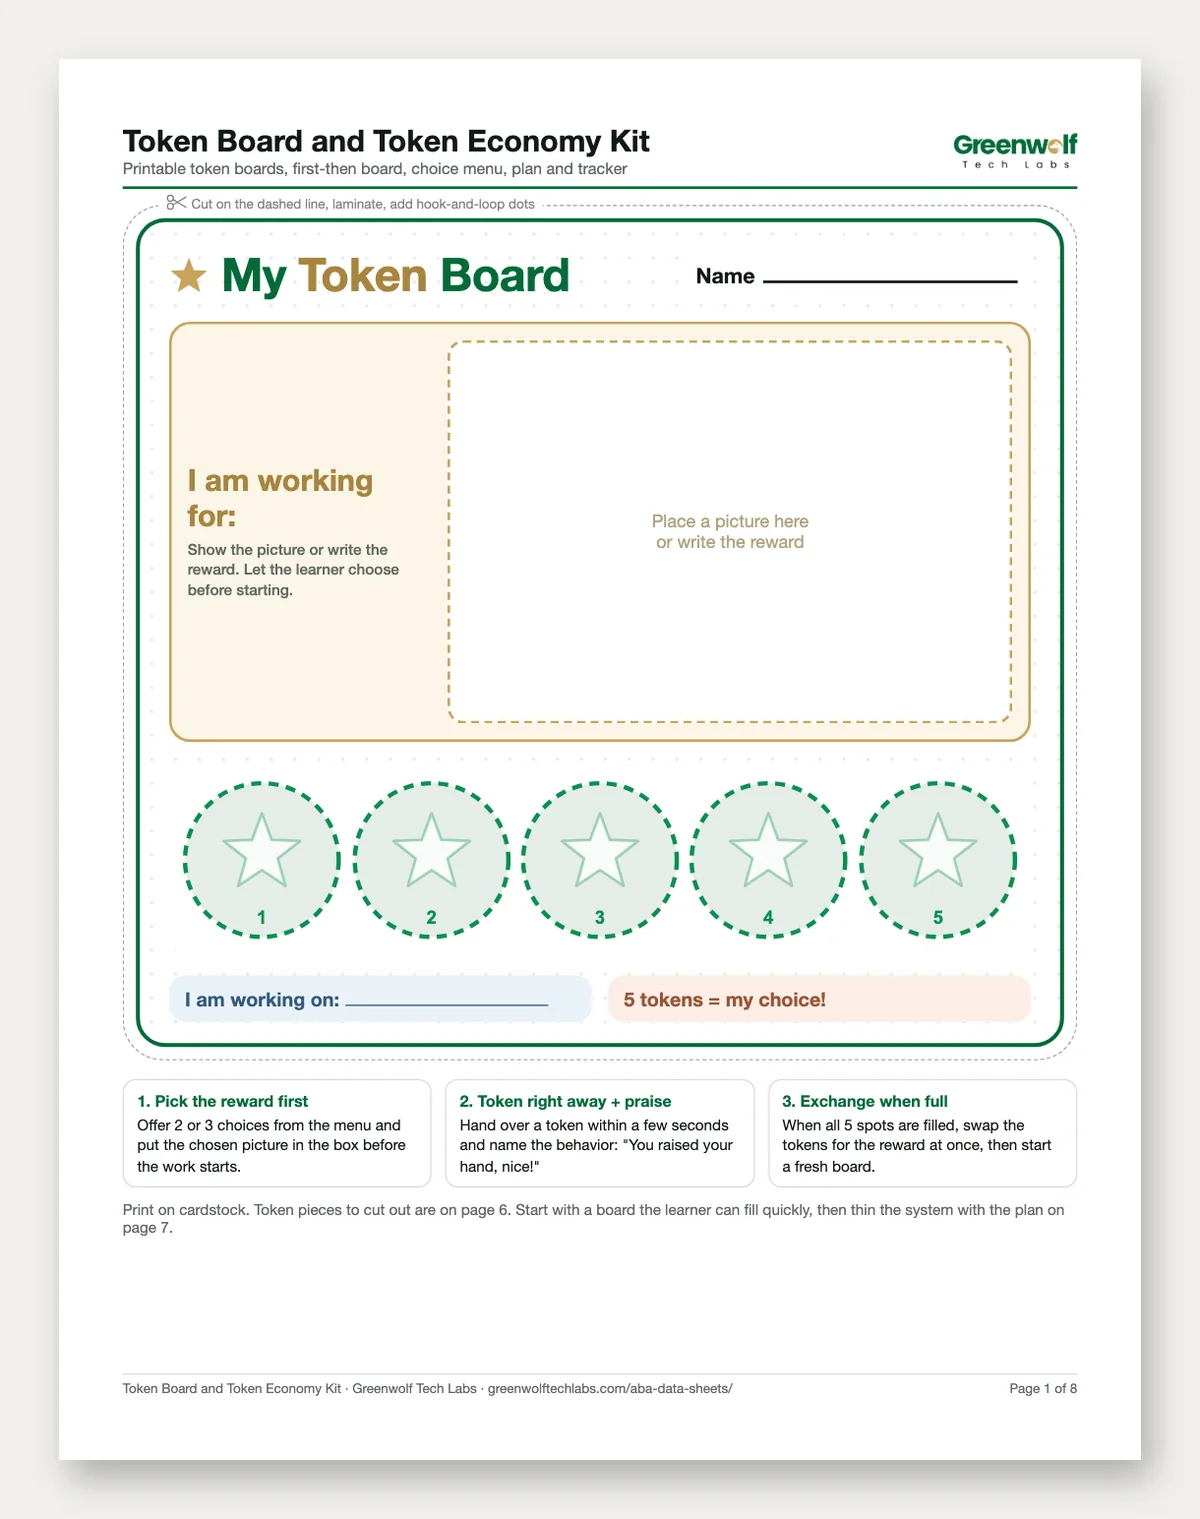
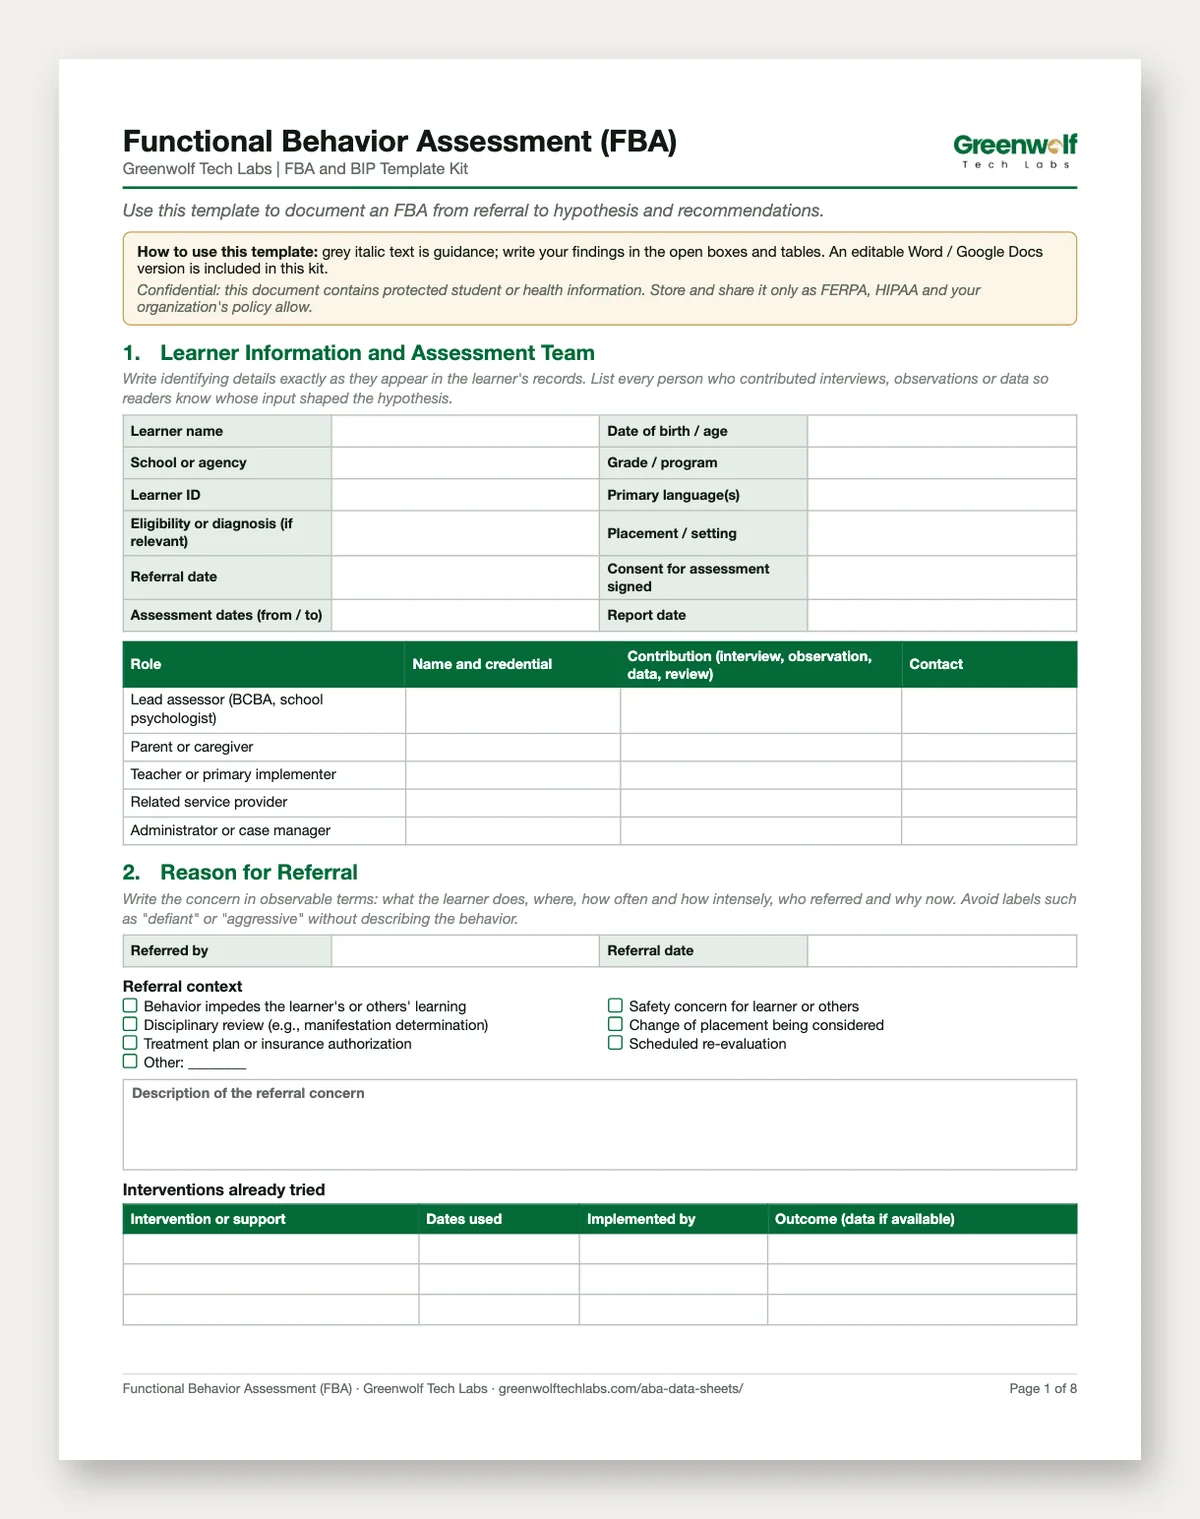
FBA and BIP Template Kit
Editable FBA and BIP templates with a hypothesis matrix and fidelity checklist.
$19Details
Need this inside your practice software?
We build ABA data collection and practice management systems around how your clinic works, so data like this is captured once and reported automatically.
Part of our Healthcare Practice Automation hub. Start with our healthcare workflow automation.
Healthcare Practice Automation
More on healthcare workflow automation
ABC Chart and ABC Data Sheet: Antecedent, Behavior, Consequence
An ABC chart records the antecedent, behavior and consequence of each incident. Free printable ABC chart PDF, filled-in examples and how to analyze ABC data.
BCBA Supervision Tracking for Supervisors and Trainees
Track BCBA fieldwork and RBT supervision hours, monthly percentages, contacts and observations for every trainee, with a ready tracker or a custom system.
BIP and FBA Templates with Examples and a Competing Behavior Pathway
Editable BIP and FBA templates in Word and PDF, with a worked FBA-to-BIP example, a competing behavior pathway and hypothesis statements for each function.
Token Board Template, Reward Chart and Token Economy Kit
Free printable token board template, plus how to set up a token economy, choose rewards by age, use a first-then board and thin tokens step by step.
Dental Appointment Reminders That Cut No-Shows and Fill the Chair
Automated dental appointment reminders over WhatsApp and SMS that confirm visits, fill recall gaps and cut no-shows, using the tools your clinic already runs.