

Templates and trackers
Food Cost Calculator and Recipe Costing Template (Excel)
Food cost calculator and recipe costing template for Excel and Google Sheets: yield, plate cost, food cost % formula, menu pricing and menu engineering.
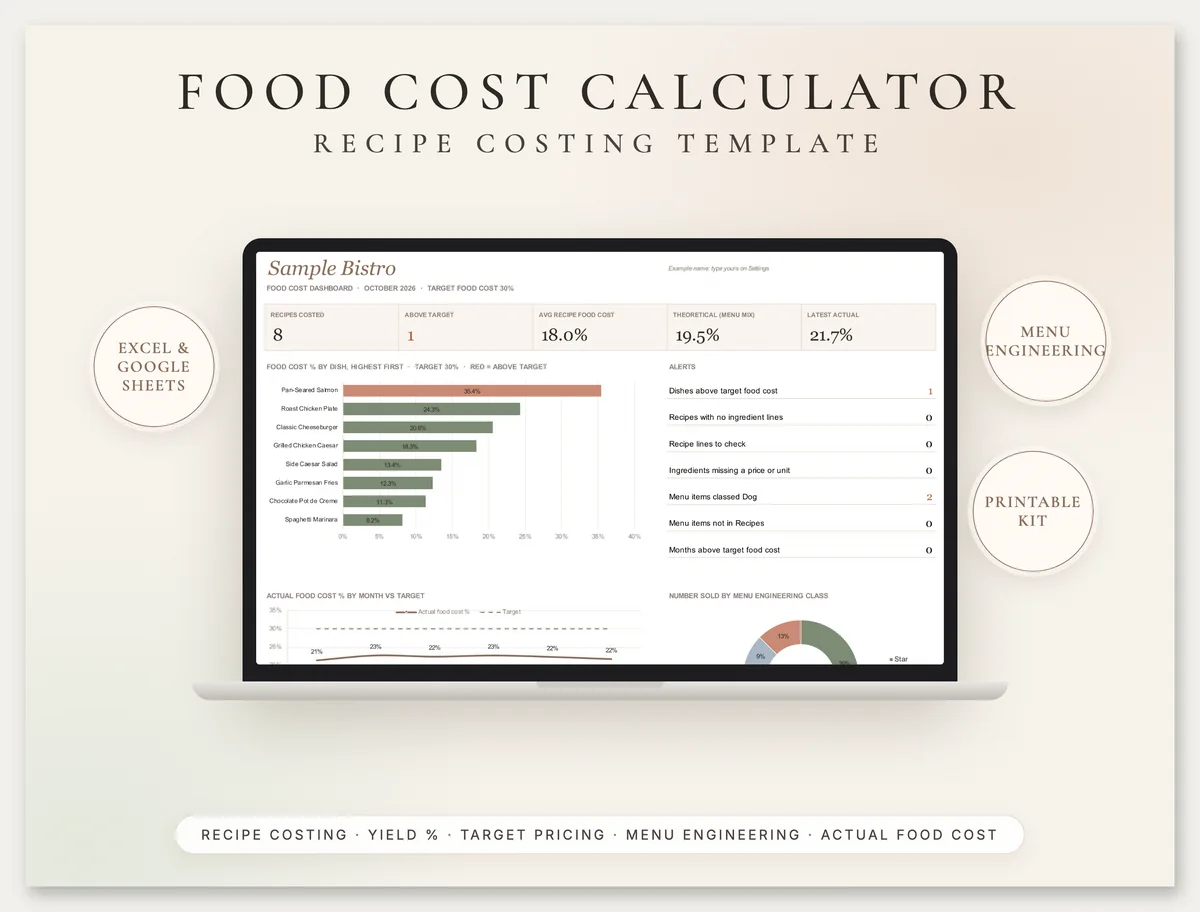
For chefs, restaurant owners, caterers and food trucks
Food Cost Calculator and Recipe Costing Template
$19USD · one-time purchase · instant download
Price every ingredient once with its real usable yield, cost every recipe to the cent in any unit, and see which dishes earn their place on the menu. The workbook works out cost per portion, food cost %, the price that hits your target and a Star, Plowhorse, Puzzle or Dog class for every dish.
- Ingredient price list for 500 items with yield % and automatic conversion between g, kg, oz, lb, ml, l, fl oz, cup, tbsp, tsp, qt, gal, each and dozen
- Recipe costing for up to 100 recipes and 3,000 ingredient lines, with cost per portion, food cost % and contribution margin
- Target price calculator: menu price from cost and target food cost %, rounded up to your step, plus a price-at-target table
- Menu engineering by category using the Kasavana and Smith 70% popularity rule and weighted average contribution margin
- Period food cost tab: opening inventory, purchases, closing inventory, staff meals, comps and transfers, against your target
- 4-page printable kit: formulas, recipe costing card, menu engineering worksheet and monthly food cost worksheet
You get: Excel workbook · Google Sheets-ready · 4-page printable PDF (US Letter)
Secure checkout by Razorpay. Cards accepted worldwide, charged in US dollars. Files arrive on screen and by email. Refund policy
02
What is a food cost calculator?
A food cost calculator is a worksheet that turns ingredient invoice prices into the cost of one portion of a dish, then divides that cost by the menu price to give the food cost percentage. It shows how much of each sale goes on ingredients, what the dish should sell for and how much money it keeps.
A recipe costing template does the middle step: it lists every ingredient in a recipe with the quantity used, converts that quantity into the unit you buy in, allows for trim and waste, and adds the lines up. A menu costing spreadsheet repeats that for the whole menu and adds the sales numbers, so you can see which dishes carry the business and which ones only look busy.
This page explains the food cost percentage formula for a single plate and for a month, how yield changes the true cost of an ingredient, how to set a menu price from a target food cost percentage, and how menu engineering classifies dishes. Each method links to the published source it comes from. The template puts all of it in one Excel and Google Sheets workbook.
Last reviewed: 30 October 2026.
03
Free printable recipe costing card (PDF)
Download the recipe costing card from the kit for free: recipe costing template (PDF, 1 page, US Letter). It has 16 ingredient lines with columns for the recipe quantity, the as-purchased price and pack, yield %, usable cost per unit and line cost, then boxes for total recipe cost, cost per portion, food cost %, price at target and contribution margin. Use it on the line or at the pass when you want to cost a special by hand.
The paid kit adds the workbook, which does every conversion and sum for you, keeps 500 ingredient prices in one place so a price change updates every recipe that uses it, and adds the menu engineering, target pricing and period food cost tabs, plus the menu engineering and monthly food cost worksheets in print.
04
Food cost percentage formula (plate and period)
Food cost percentage is the cost of the food divided by the food sales it produced. For one dish that is cost per portion divided by menu price; for a month it is net food cost divided by food sales. Both versions are in the BCcampus open textbook Basic Kitchen and Food Service Management, written by the BC Cook Articulation Committee (menu engineering chapter, monthly food costs chapter).
| Measure | Formula | Example |
|---|---|---|
| Food cost % for a dish | Cost per portion / menu price | $4.80 / $14.00 = 34.3% |
| Menu price at a target | Cost per portion / target food cost % | $4.80 / 30% = $16.00 |
| Cost markup factor | Menu price / cost per portion (or 1 / food cost %) | $14.00 / $4.80 = 2.92 |
| Contribution margin | Menu price - cost per portion | $14.00 - $4.80 = $9.20 |
| Cost of food for a period | Opening inventory + purchases - closing inventory | $10,000 + $7,500 - $9,000 = $8,500 |
| Net food cost | Cost of food - staff meals - promotions - transfers out + transfers in | Removes food that was never sold to a guest |
| Food cost % for a period | Net food cost / food sales | $5,500 / $13,700 = 40.1% |
The plate version is your theoretical food cost: what the food should cost if every portion is exact and nothing is wasted. The period version is your actual food cost from counts and invoices. The workbook calculates both: the Dashboard weights each dish's theoretical cost by how many you sold and sets it beside the latest actual figure. Some gap is expected; a wide one is a sign to check portioning, waste, theft, comps that were not recorded and ingredient prices that are out of date.
There is no official target food cost %. It depends on your concept, prices and labor model, so the workbook asks you to set your own on the Settings tab and lets you set a different target for any dish.
05
Yield and unit conversion: why the invoice price is not the real cost
Most ingredients lose weight before they reach the plate. The usable (edible portion) cost is the as-purchased cost divided by the yield percentage, and yield % is usable weight divided by purchased weight. The BCcampus textbook gives the method and examples such as a 2,500 g tenderloin that trims to 1,750 g, a 70% yield (yield testing chapter). For produce and many proteins, the USDA Food Buying Guide publishes yield data you can start from, but your own yield test on your own product is the better number.
| Ingredient (sample) | As purchased | Yield | Usable cost |
|---|---|---|---|
| Chicken breast, 40 lb case | $119.60 = $2.99 per lb | 92% | $0.2031 per usable oz |
| Russet potatoes, 50 lb | $28.50 = $0.57 per lb | 81% | $0.0440 per usable oz |
| Asparagus, 11 lb | $48.00 = $4.36 per lb | 56% | $0.4870 per usable oz |
The second trap is units. You buy chicken by the pound and portion it by the ounce, buy oil by the liter and use it by the tablespoon, buy eggs by the dozen and use them one at a time. The workbook converts every unit to a base unit (grams, milliliters or each) with the exact factors: 1 oz = 28.349523125 g and 1 lb = 453.59237 g, as listed in NIST Special Publication 811, Appendix B.9; 1 US fl oz = 29.5735295625 ml, with the cup, tablespoon, teaspoon, quart and gallon defined from the fluid ounce. Weight and volume do not mix: if you buy flour by weight, cost it by weight. The Recipe Lines tab flags a line that tries to use a cup of an ingredient bought by the pound.
06
Menu engineering: Stars, Plowhorses, Puzzles and Dogs
Menu engineering is the method published by Michael Kasavana and Donald Smith in 1982 that rates each dish on two measures within its menu category: popularity (its share of the category's sales) and contribution margin (menu price minus food cost). The two ratings place every dish in one of four classes.
A dish is popular when its sales mix is at least 70% of an even share. With 8 items in a category, an even share is 12.5%, so the threshold is 12.5% x 70% = 8.75%. A dish has a high contribution margin when its margin is at least the category's weighted average contribution margin: the total contribution margin of all items sold divided by the number of items sold. This is how LeBruto, Quain and Ashley describe the Kasavana and Smith model in FIU Hospitality Review (1995) (Menu Engineering: A Model Including Labor), and how the BCcampus textbook teaches it (principles of menu engineering).
| Class | Popularity | Contribution margin | Usual action |
|---|---|---|---|
| Star | High | High | Keep the recipe and menu position; test a small price rise |
| Plowhorse | High | Low | Raise the price carefully or lower the plate cost |
| Puzzle | Low | High | Promote it: better position, server suggestion, rename or reprice |
| Dog | Low | Low | Rework, replace or remove it |
Menu engineering deliberately ranks dishes by the dollars they keep, not by their food cost percentage: a steak with a 38% food cost can earn more per plate than a pasta at 22%. The authors cited above also point out its limits. It ignores labor, so a high-margin dish that takes a cook ten minutes may not be the winner it looks, and a Dog can still earn its place if it brings in a group or keeps a regular. Use the classes to ask questions, not to delete dishes automatically.
07
How to cost a recipe in 5 steps
Price the ingredients
From your latest invoices, enter each item's pack price, pack size and pack unit. Note the date so you know when a price is stale.
Set the yield
Weigh what you buy and what is usable after trimming, peeling or boning. Usable divided by purchased is the yield %. Leave it at 100% for items with no loss.
List the recipe lines
For each dish, enter every ingredient with the quantity in the unit the kitchen uses: oz of chicken, tbsp of oil, each egg. Include garnish, oil, salt and sides.
Divide by portions
Enter how many portions the recipe makes. Batch recipes such as sauces, pasta and desserts are costed once and divided down.
Price to your target
Set your target food cost %. The workbook divides cost per portion by it, rounds up to your step and flags any dish whose current price misses the target.
08
Worked example: a sample bistro menu
Sample data, included in the workbook so you can see every formula working. A bistro prices 24 ingredients from its October invoices and costs 8 dishes with a 30% target food cost.
- Pan-Seared Salmon: a 7 oz portion of salmon at an 85% yield, 5 oz of asparagus at a 56% yield, butter, lemon, a tablespoon of oil and salt cost $10.27 a plate. At $29.00 that is a 35.4% food cost, above the 30% target, so the dish is flagged. The price that hits 30%, rounded up to the next $0.25, is $34.25.
- Classic Cheeseburger: 6 oz ground beef, a bun, two cheddar slices, tomato, onion, 8 oz of potatoes for fries and salt cost $3.50. At $17.00 that is only 20.6%, well under target, yet it keeps less per plate than the average main.
- Chocolate Pot de Creme: a 12-ramekin batch costs $13.59, so $1.13 a ramekin and 11.3% at $10.00.
- Actual food cost: October opened with $7,920 of stock, bought $16,850, closed at $8,310, and had $610 of staff meals, $280 of comps, $180 transferred to the bar and $90 back from it. Net food cost $15,480.00 on food sales of $71,250 is 21.7%.
Menu engineering for the four mains (970 sold) puts the popularity threshold at 17.5% and the weighted average contribution margin at $14.46:
| Main | Sold | Sales mix | Price | Cost | CM | Class |
|---|---|---|---|---|---|---|
| Classic Cheeseburger | 420 | 43.3% | $17.00 | $3.50 | $13.50 | Plowhorse |
| Pan-Seared Salmon | 160 | 16.5% | $29.00 | $10.27 | $18.73 | Puzzle |
| Spaghetti Marinara | 300 | 30.9% | $15.00 | $1.23 | $13.77 | Plowhorse |
| Roast Chicken Plate | 90 | 9.3% | $18.00 | $4.37 | $13.63 | Dog |
The Plowhorse sells well but keeps less per plate than the average main, so it is the first candidate for a small price rise or a cheaper side. The Puzzle earns the most per plate but sells too few: move it up the menu and brief servers before you discount it.
09
Common recipe costing mistakes
10
What is inside
Ingredients and units
500-row price list with pack price, size and unit, yield %, usable cost per g, ml or each, and a cost per any unit you choose. 14 units built in, 4 spare for your own.
Recipes and recipe card
100 recipes and 3,000 ingredient lines with line status checks, cost per portion, food cost %, contribution margin, and a printable card for any dish.
Pricing and menu engineering
Price at target, rounded suggested price, a price table, and Star, Plowhorse, Puzzle or Dog for every dish within its category.
Period food cost and dashboard
Monthly actual food cost % with staff meals, comps and transfers, set against theoretical food cost and your target.
11
Related templates and services
Browse all our compliance templates and record kits. If stock counts are the hard part, see our inventory spreadsheet checklist. Restaurants that want more covers can read about our social media marketing for restaurants, and groups that want costing linked to their POS and suppliers can have a custom app built in AppSheet.
12
Food cost calculator questions
What is the formula for food cost percentage?
How do I calculate plate cost?
What should my food cost percentage be?
How do I price a menu item from food cost?
What are Stars, Plowhorses, Puzzles and Dogs?
How does the template handle ounces, pounds and grams?
Does it work in Google Sheets?
13
Important
This calculator and template help you organize ingredient prices, recipe costs and menu prices. The results are only as good as the prices, yields, portions and sales you enter, so check them against your invoices and counts. It is not accounting, tax or financial advice. Greenwolf Tech Labs is not affiliated with the authors or publishers cited on this page. See our terms and refund policy.
Part of our Compliance Templates hub. Start with our compliance templates.
Compliance Templates
More on compliance templates
Rent Roll Template (Excel and Google Sheets) with Example
Rent roll template for Excel and Google Sheets with a worked example: what a rent roll is, the fields lenders require, occupancy and arrears aging.
RFI Log Template, Submittal Log and Change Order Log (Excel)
RFI log template with submittal log and change order log for Excel and Google Sheets: due dates, ball in court, at-risk submittals and contract sum.
JSA Template: Job Hazard Analysis Form, Examples and Risk Matrix
Free JSA template (PDF) and job hazard analysis form, built on OSHA 3071: steps, hazards, controls, a 5x5 risk matrix and 5 worked JHA examples.
OSHA 300 Log in Excel: 300, 300A and 301 Recordkeeping
OSHA 300 log in Excel with an automatic 300A summary, 301 details and TRIR and DART rates, plus 1904 rules: what to record, 7 days, posting and ITA.
VEVRAA and Section 503 Affirmative Action Plan Template (2026)
VEVRAA explained for federal contractors: who needs a plan, the 5.1% hiring benchmark, 2026 rule changes, VETS-4212 and an AAP template with a free calendar.
Tell us where the week goes
A senior consultant will map where the time goes, name what is worth automating and what it takes. No obligation after it.